Market Overview: DAX 40 Futures
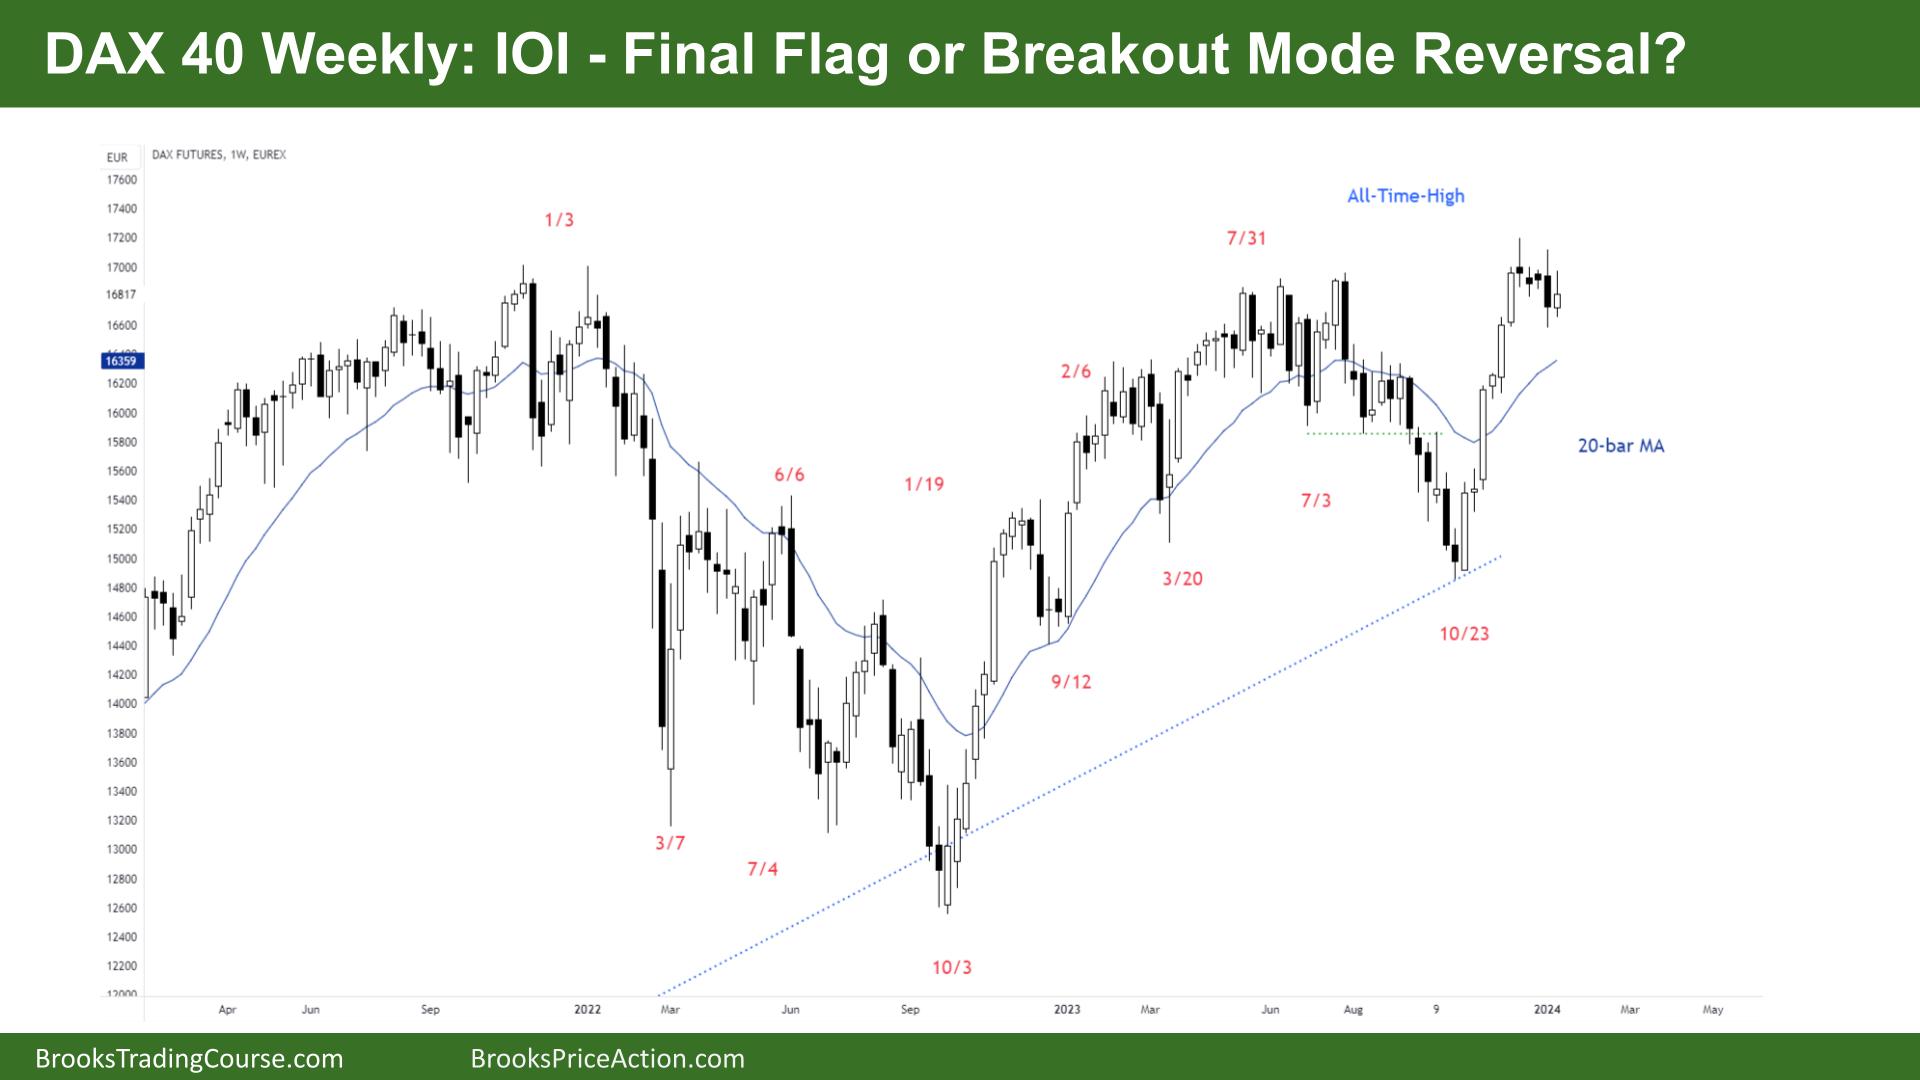
DAX futures went sideways last week with an inside-outside-inside pattern (ioi.) The bulls see a final flag before one more leg up. The bears see a parabolic wedge, a tight channel up at the top of an expanding triangle. No good signals in 5 bars is TR price action, so we might be in breakout mode again and head back to the MA. The bulls want a High 2, but we already tested the highest bull close, so a difficult buy to take now.
DAX 40 Futures
The Weekly DAX chart

- The DAX 40 futures went sideways in an ioi (Inside-outside-Inside) pattern last week.
- IOI is a breakout mode pattern, and the context after a strong bull move could be a final flag. That would mean one more leg up.
- The bulls wanted a pullback to buy lower for another move up. But now, 4 bear bars is no longer trending behaviour. This could mean the first reversal up will be minor.
- The bears wanted to sell above the steep bear leg. They saw a trading range and triggered a second sell signal. They see a Low 2 sell now but too many tails for sell below.
- Always in bulls could have exited below one of the signals. Most took profits at the highs after a buy climax.
- The bulls that bought the highs probably took a smaller position and will look to add on after two legs down. We may not have started the second leg yet.
- The bears could have sold under and above the bear bars. But it is still a lower probability trade.
- Breakout-mode-type patterns this far away from the MA generally return to the average price.
- Inside bar, so a weak buy signal, but context is good for more up. The problem is where do you put your stop?
- More sellers might be above that bar, betting on a good risk-to-rewards setup to the MA.
- Better to be short or flat. If you’re long, it is better to trade a small size and add on at the MA or another good bull bar.
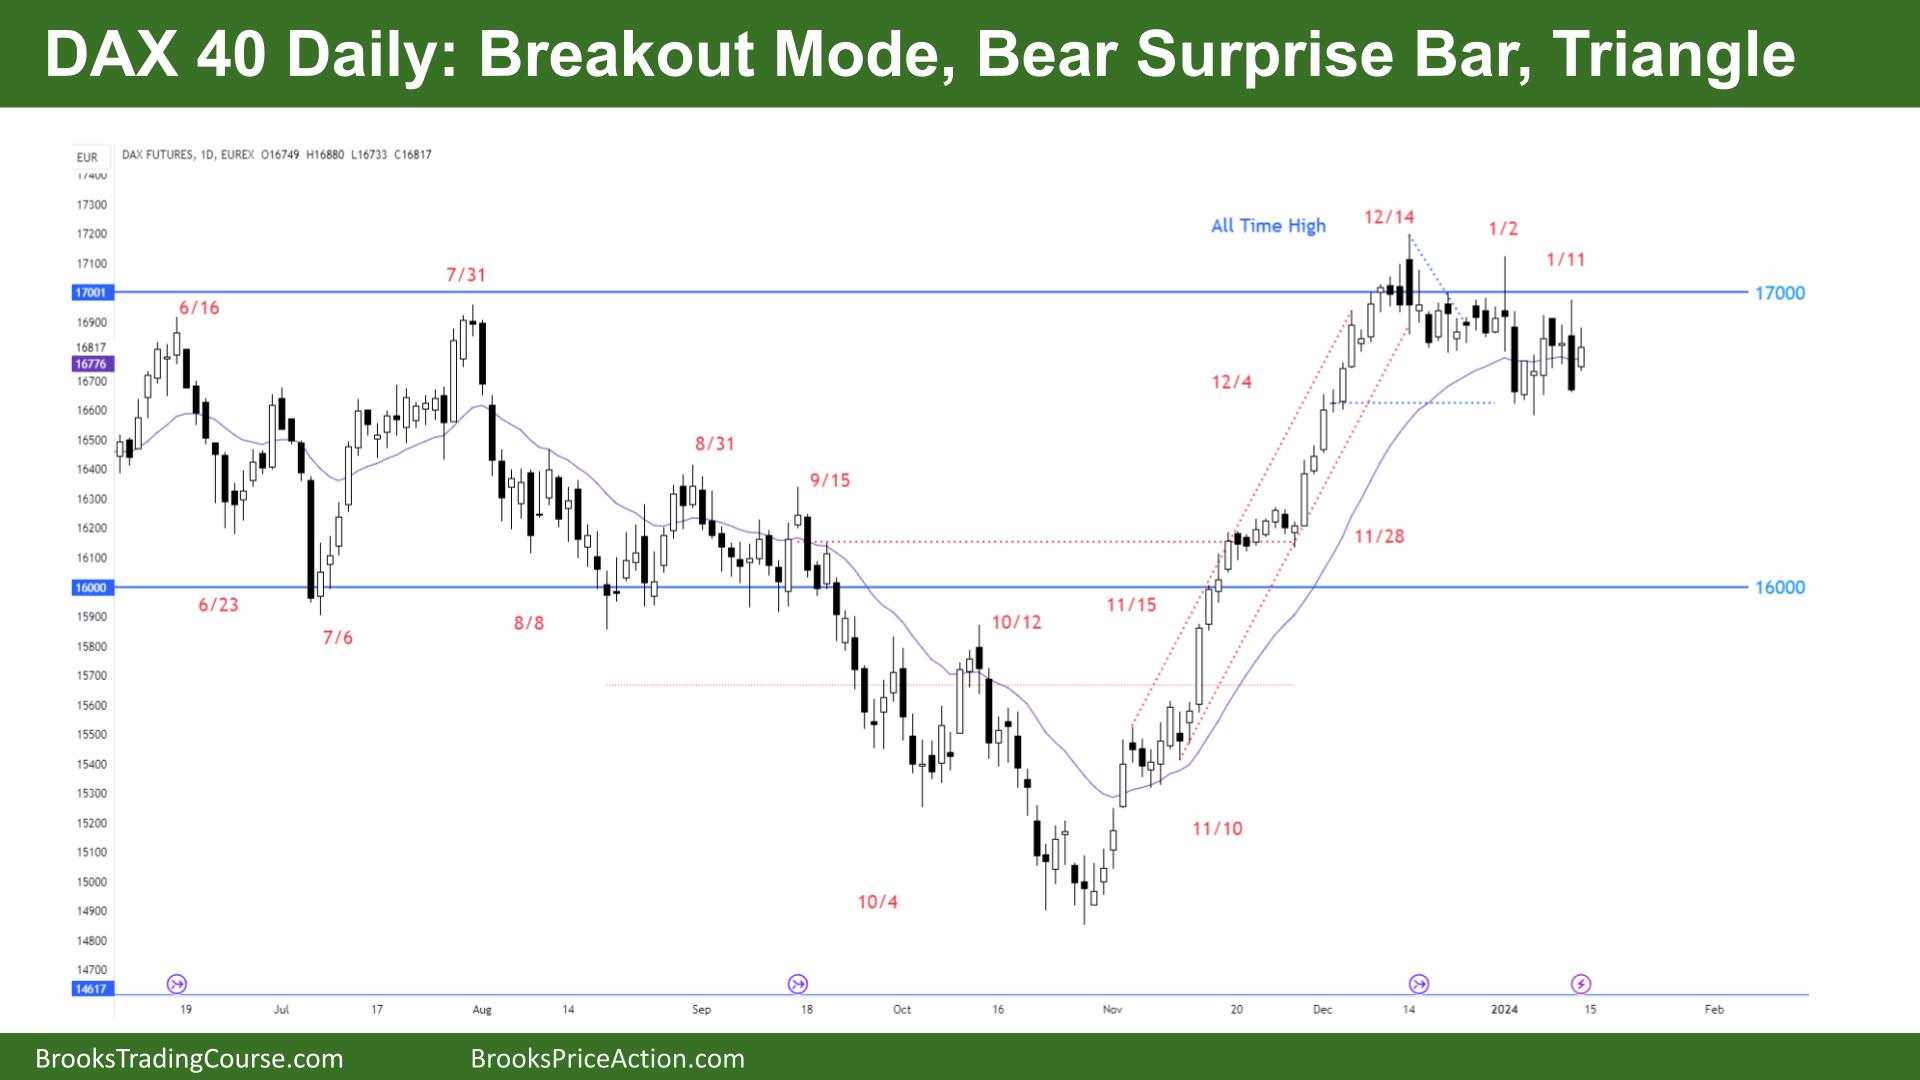
The Daily DAX chart

- The DAX 40 futures hugged the MA on Friday with a bull inside bar after a big bear outside down bar: a bear surprise.
- The follow-through from the bear surprise was bad, so trading range price action.
- Traders might be wondering if there should be a second leg after that.
- The bulls see a tight bull channel, and we tested the small doji from December. So it is a double bottom and a trading range. The bulls want a good buy signal.
- The bears see an endless pullback to the MA, about 3 legs and sideways. it is tight so many ways to count it.
- Is it a wedge bottom? With 8 bars at the MA, it is probably easier to consider it a TTR and breakout mode.
- Bulls want a good bull bar with FT above the MA.
- Bears want another bull bar to fail and get consecutive bear bars below the MA.
- Both sides are likely to get disappointed in this trading range.
- I think we will go back up and test 17000 again. probably sellers above and buyers not far below.
- Most traders should be flat. Some bears will be swinging down, but you have had two failed breakouts now, so it might be better to exit and sell higher.
- Expect sideways to up next week.
Market analysis reports archive
You can access all weekend reports on the Market Analysis page.

