Market Overview: DAX 40 Futures
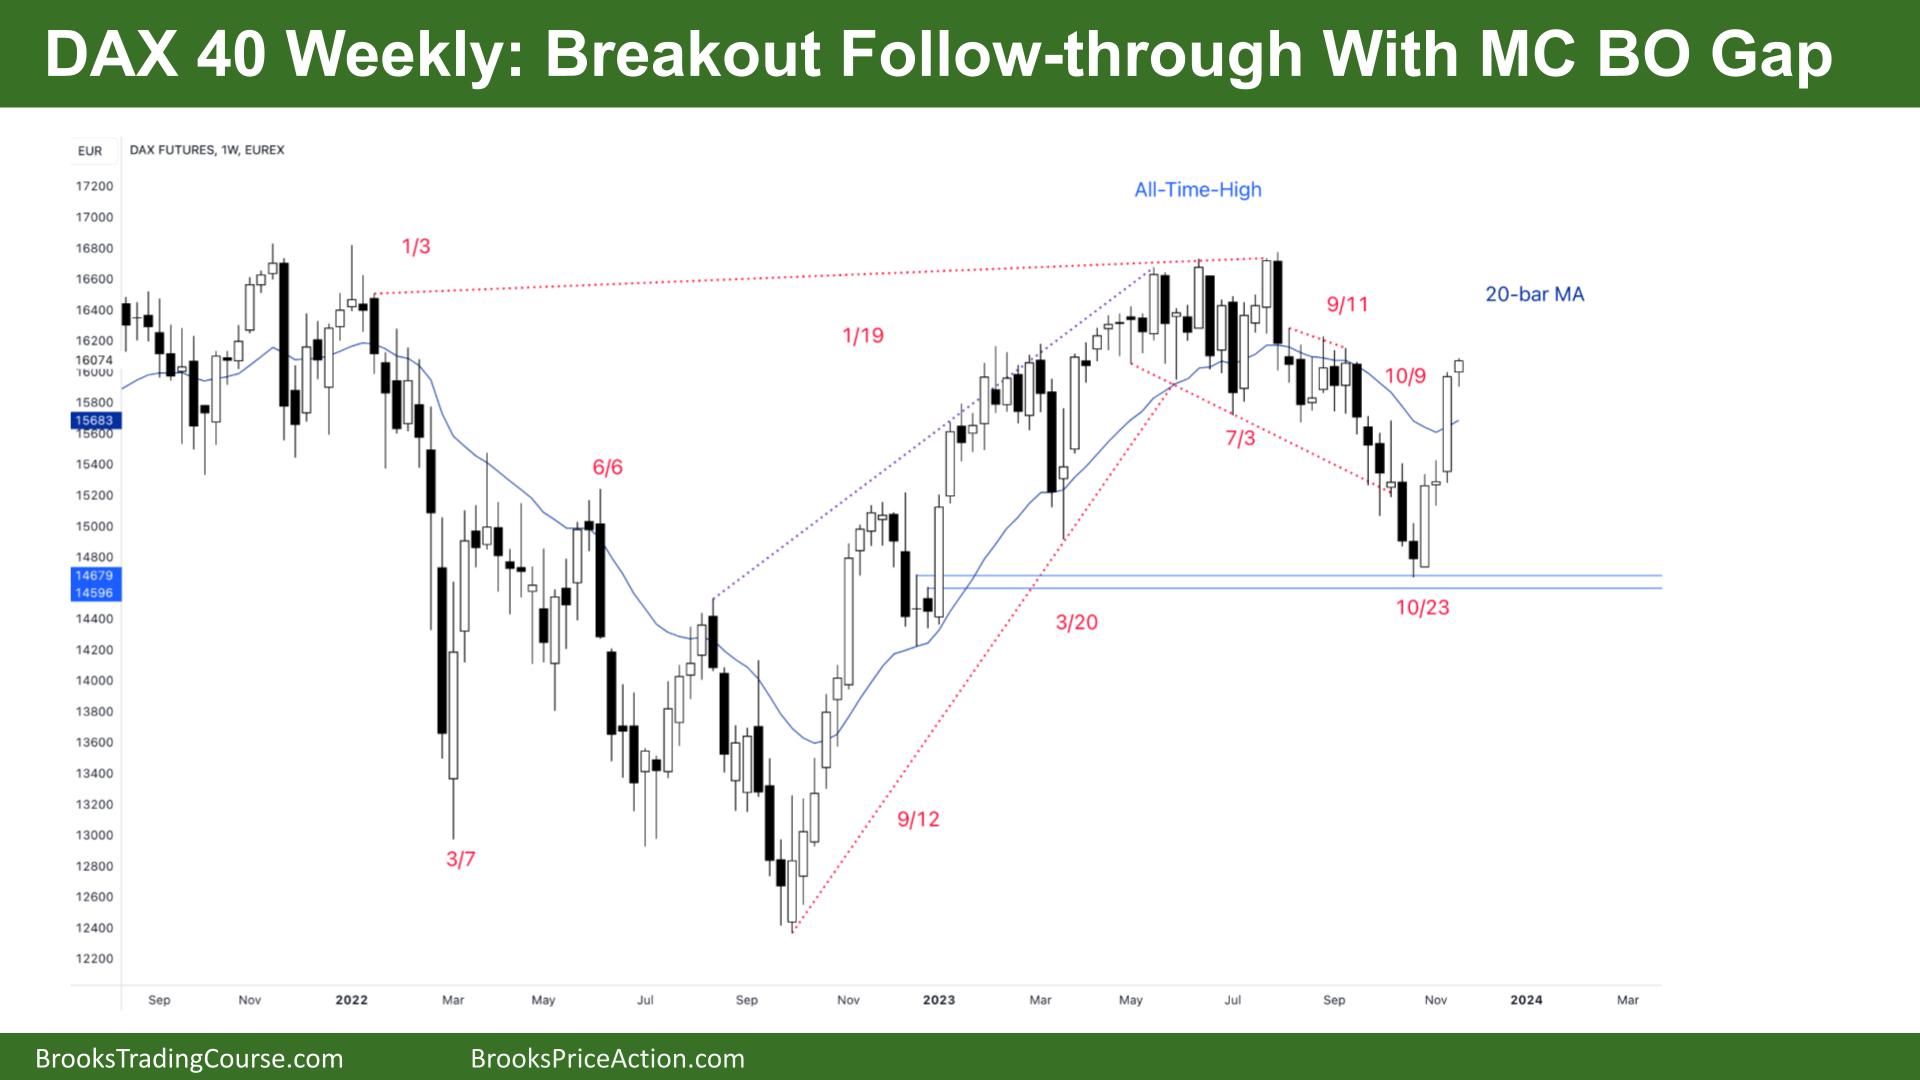
DAX futures continued up last week with a breakout follow-through, creating a microchannel (MC) with a breakout gap (BO Gap.) We are always in long, so traders should be long or flat. Now we have a small signal bar – small risk. That increases the chance of a test above and below it. Bulls want this to be the start of three more legs but we should go sideways around this price – 16000.
DAX 40 Futures
The Weekly DAX chart

- The DAX 40 futures got a breakout follow-through last week with a small bull bar closing on its high with a small body gap.
- The bar is small, so we might need to test both sides. It is closing on its high, so we will likely gap up next week.
- The bar last week was a bull surprise bar, and traders expected a second leg. But most were watching and waiting for the follow-through bar. The bulls needed anything except a bear bar, and they got it.
- That means there is a high probability of a second leg up. Sometimes, the market races up without waiting for value traders to get in at a better price.
- The risk is large, so those traders want to test the all-time high.
- Remember that the continuous contract is re-stated, so it looks like the ATH is not the ATH.
- There’s nothing to sell here for the bears. Any bears that were short, should have exited with two good bars against them and now an opposite MC.
- Some traders see a V-bottom. But they are typically a double bottom testing strongly a prior price from the left. In this case the very strong January breakout bars.
- So, if that is the bottom of the range, traders should avoid doing too much in the middle and expect two legs.
- Always in long, so it’s better to be long or flat.
- I suspect we will pull back to the MA soon and go sideways. However, we are forming a possible parabolic wedge and might get two legs sideways to down to the MA soon.
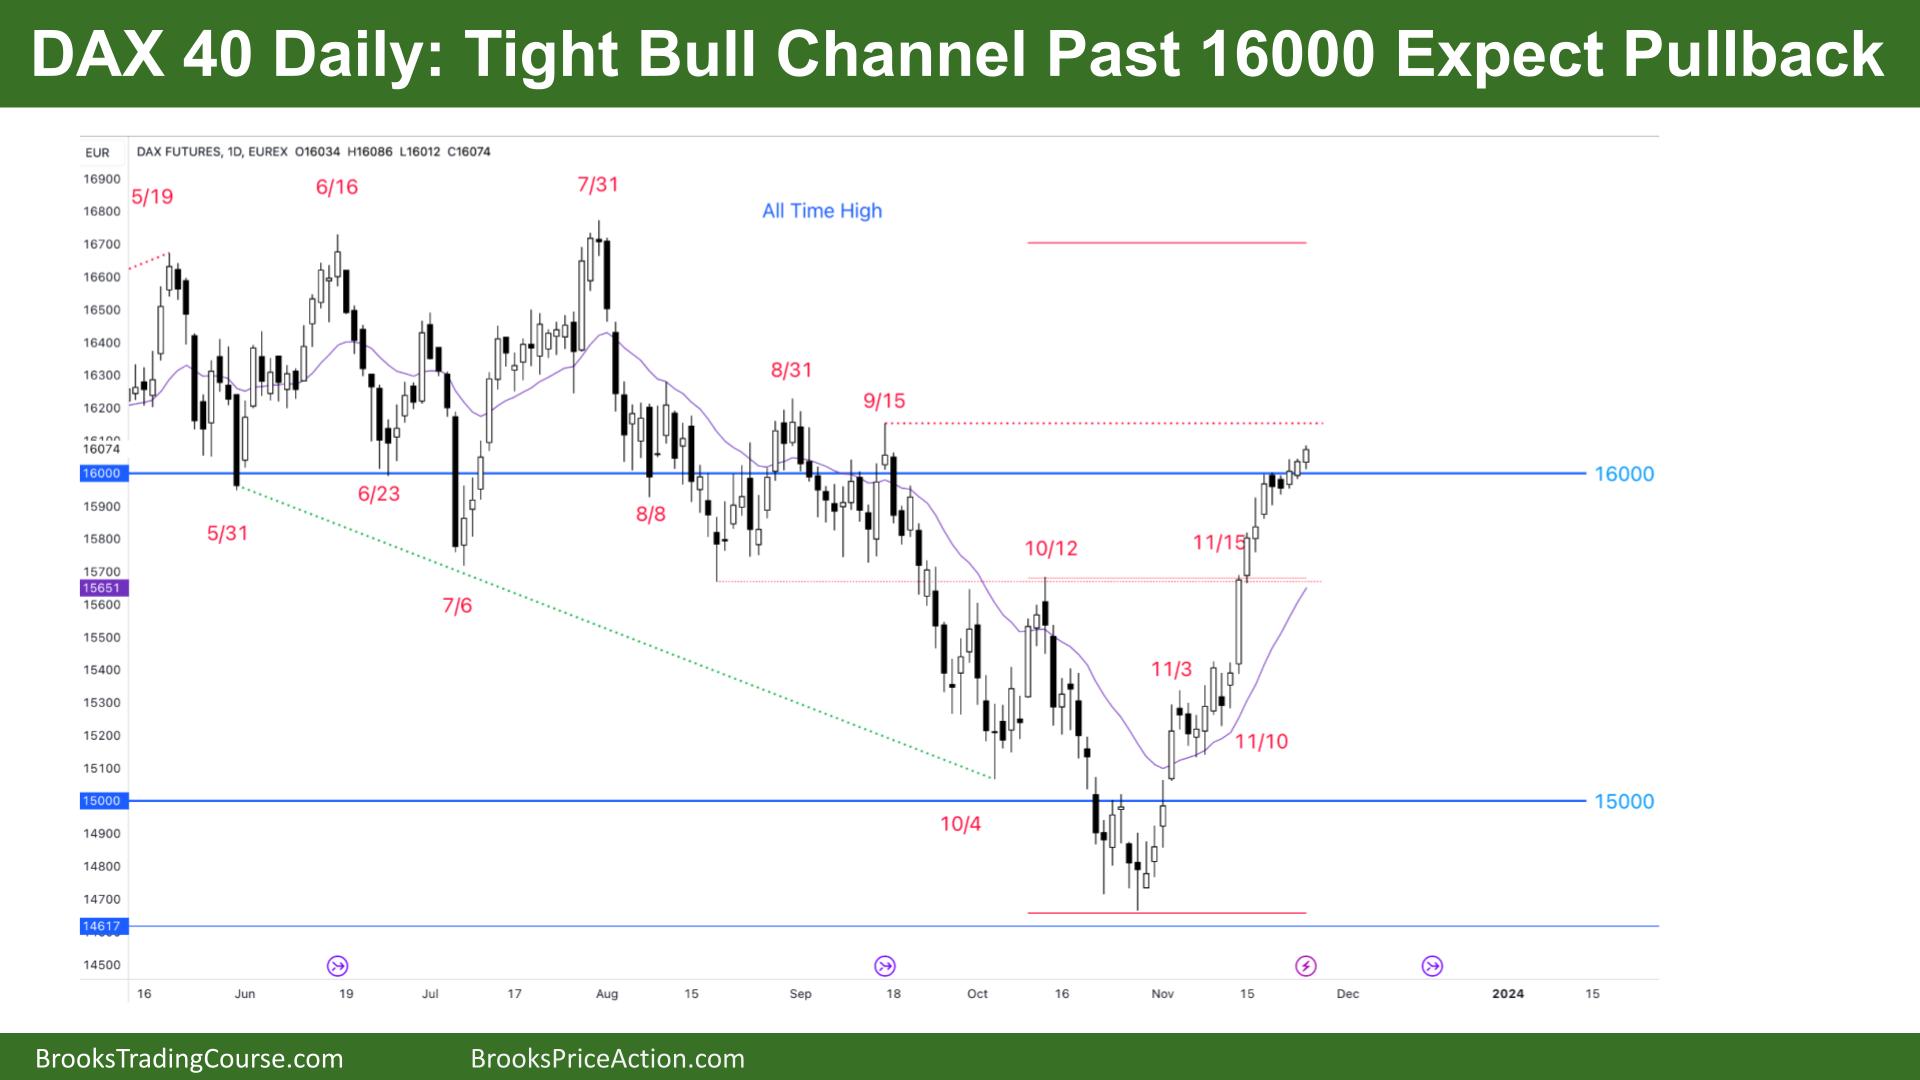
The Daily DAX chart

- The DAX 40 futures moved higher in a tight bull channel since the start of the month.
- The last leg is a bull microchannel, which means no lows below the lows of prior bars. That is typically a BO on a higher time frame. In this case, it is the weekly chart.
- There is nothing to sell, so traders should be either long or flat.
- It is a breakout follow-through on a HTF so a reversal on the daily is likely a pullback on the HTF.
- We are always in long.
- We just raced past the 16000 Big Round Number, which is a magnet, and likely some traders were short there. But it is a trading range, so moves can quickly race past support and resistance.
- Bears who were scaling in did not have a good signal bar, so they will scale-in higher, and likely make money.
- Bulls buying here have a big risk, which means a high probability and might need to sit through a large pullback to get their reward.
- Some bulls see the breakout above October 12th as a possible measured move up the ATH. That is reasonable. Other traders might wait for a pullback to test that breakout point before getting into the trade up to the highs.
- If bulls get one more strong bar, that will signal a lot of profit-taking. Bears expected the price to test the highs of the last sell climax, which is around this price, so it is a possible place to exit.
- Expect sideways to up next week.
Market analysis reports archive
You can access all weekend reports on the Market Analysis page.

