- Market Overview: Weekend Market Analysis
- 30-year Treasury Bond futures
- EURUSD Forex market
- S&P500 Emini futures
Market Overview: Weekend Market Analysis
The SP500 Emini futures finally had consecutive big bear days on the daily chart. It will probably correct 10% over the next few weeks.
Bond futures on the monthly chart collapsed down to support. There should be a short covering bounce in March.
The EURUSD Forex market has a wedge rally to a double top. But the rally was strong, and there might be one more new high before there is a correction.
30-year Treasury Bond futures
Bond futures monthly and weekly charts have extreme sell climax so expect bounce in March
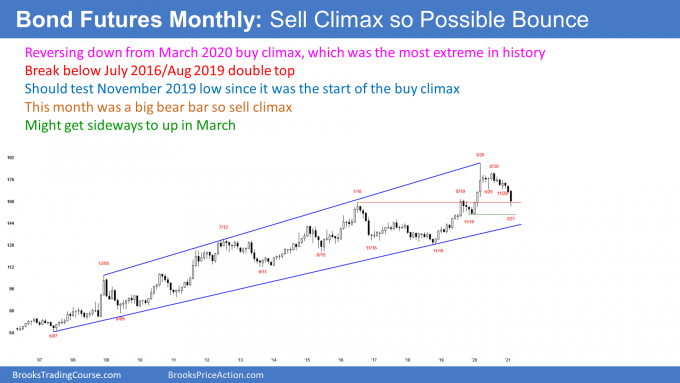
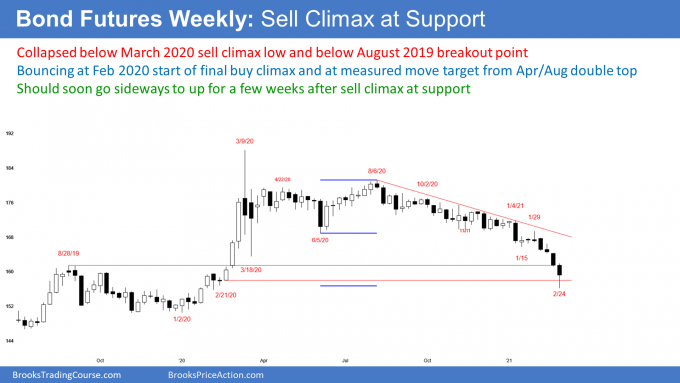
Bond futures have been collapsing on the monthly chart. I have been saying that they would fall below the March 2020 low on the weekly chart, which was the bottom of the reversal down from the buy climax. I also said that bonds should fall below the August 2019 high, which was the breakout point of the 2020 buy climax. Finally, I said bonds should test the February 2020 low on the weekly chart. That was the bottom of the final leg up in last year’s extreme buy climax on the weekly chart. Bonds reached all 3 targets this month.
A reversal from a buy climax typically tests the start of the final leg up. Therefore, the selloff should also reach the January 2020 low, which was the start of the buy climax on the monthly chart. However, with the current sell climax as extreme as it is, and at support, bonds might bounce first.
This month was the biggest bar on the monthly chart in a yearlong sell climax. It is now testing important support. Many bears will see this as an opportunity to take extremely big profits. Also, the bulls will begin to buy, betting on a short covering bounce up from support.
Can a March rally reach all of the way back up to the February high? While it probably will not, it might because the selloff has been extreme. Just like a reversal down from a buy climax tends to reach the start of the buy climax, a reversal up from a sell climax often gets drawn up to the start of the sell climax. On the monthly chart, that is either the February or January high.
But if bonds are going to rally, they will probably not go straight up. They might have to go sideways for a few bars (months) before going up. Also, they may reach the January 2020 low before there is a rally to the February high.
At the moment, they are so oversold that short covering should result in a pause and likely bounce over the next month or two. Ultimately, they will fall to the January 2020 low before rallying strongly. Also, as I have been saying for a year, they will be lower in 5 years and in 10 years.
EURUSD Forex market
The EURUSD monthly chart has both weak buy and sell signals, which means more sideways is likely
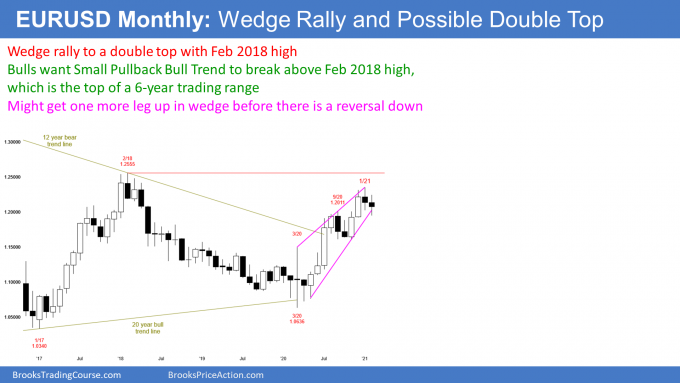
The EURUSD monthly chart has rallied strongly for the past year and is at the top of a 6-year trading range. A wedge rally to a double top is a reliable sell setup.
Traders expect higher prices, but are uncertain if the reversal down from the January wedge top has more to go. If so, a reasonable target is the bottom of the most recent leg up. That is the November low of 1.16.
The bulls are hoping that the 2nd leg up in the wedge, to the September high, was strong enough to start the count over again. Instead of March 2020 being the 1st leg up, the bulls want September to be the 1st leg. If it is, the wedge might have one more leg up to around the February 2018 high of 1.2555 before there is a correction.
Which is more likely, 1.16 or 1.25?
Is the EURUSD correcting down from a wedge top to 1.16, or is it forming a bull flag for a move up to 1.2555?
January was the sell signal bar, but it had a big tail below. That means it is a lower probability sell signal. February triggered the sell signal by going below the January low, but it closed above the January low. That means there were more buyers than sellers below the sell signal bar. Because it only had a small bear body, it is a weak entry bar, after a weak sell signal bar.
The bulls see February as a pullback in the yearlong rally. It is a High 1 bull flag buy signal bar. But it was not a big bull bar closing on its high. A bear bar is a weak buy signal bar. Also, it is forcing the bulls to buy at the top of a 3-bar tight trading range, and just below the top of a 6-year trading range. Therefore, there might be more sellers than buyers above its high.
With buyers below and sellers above, and with unconvincing buy and sell signals, the EURUSD might have to go sideways at least a little longer. If the bulls get a breakout above the December high, there probably will be sellers above that high. This is because the EURUSD is at the top of a trading range. A reversal down would be from a wedge, and it would probably reach the November low.
If the bears get a breakout, there will probably be buyers around the November low. This is because last year’s rally was very strong, and it came from a higher low compared to the 2017 bear trend low.
With sellers above 1.25 and buyers below around 1.16, the EURUSD will probably be rangebound for 2021. However, the wedge rally to a double top is a fairly reliable topping pattern. It is slightly more likely that the EURUSD will work down to the November low before breaking above the December high.
S&P500 Emini futures
The Monthly Emini chart has minor parabolic wedge top
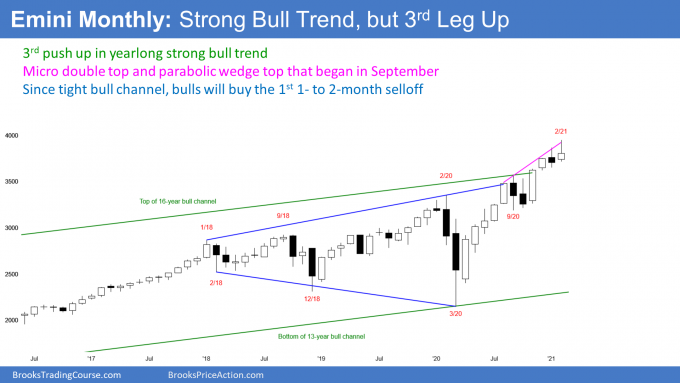
The monthly S&P500 Emini futures chart traded above the January high, but finished the month in the middle of its range. That is neutral, like January’s small body, and it lowers the probability of a big move up or down in March.
The monthly chart has had 3 thrusts up from the pandemic low. If there is a reversal down within the next couple of months, traders would see the yearlong rally as a parabolic wedge top. On the monthly chart, the wedge only has 6 bars. If March reverses down, the top will be minor. Therefore, once there is a reversal down, it should only last for a couple bars (months), like most reversals since 2016 (in 2018, one reversal lasted for 3 months).
Where is support?
When a bull channel is tight like this, traders typically are eager to buy the 1st selloff. There will be bulls looking to buy a 10% and a 20% selloff. Traders pay attention to these numbers. When a market sells off 10%, the selloff is a correction, and not a pullback. Once it falls 20%, it is a bear market. The bulls buy these key levels as support, betting that once the name of the selloff changes, there will be other buyers betting on a resumption of the bull trend.
A 10% correction would be at the November 10 low at 3,500. This is important on the weekly and daily charts (see below).
A 20% correction is around the October low at 3200. There was a 2-month trading range there and that is a possible Final Bull Flag on the weekly chart. A Final Flag is often a magnet.
Others will look to buy based on key prices on the monthly chart. The 2-month trading range on the weekly chart is within a 4-bar tight trading range on the monthly chart. A tight trading range is an area of agreement. If the Emini trades down, traders might wait for it to get back to that neutral area before they look to buy again. That range was between 3,200 and 3,600.
Another chart target is the September high around 3,550. That was the breakout point for the 3rd leg up. After the 2nd leg up broke above the February 2020 high, it pulled back below that high 2 months later. Trends tend to weaken as they get older. Therefore, the Emini should pull back below the most recent breakout point (the September high) within a couple months.
Can it get down to 3,200 at the bottom of the October trading range? That is about a 20% correction, and it might be too far for a first leg down. The bull channel has been tight, and that means traders are eagerly buying small pullbacks. There might too many eager bulls buying at around 10% down for the 1st leg down to fall 20%.
Can the Emini continue to above 4,000 without pulling back?
What about the bull case? There has only been a single pullback to below a prior month’s low in a year, and that pullback was only a single bar. The bulls have been very aggressive.
Can the rally continue up to above 4,000 without March going below the February low? If a trader just looks at the monthly chart, February was neutral. Therefore, one could conclude that there is a 50% chance that March will go above the February high and test 4,000, and a 50% chance it will fall below the February low.
But with January and February having small bodies and largely overlapping one another, there is a reduced chance of a big move up or down from here within the next few months. That means it probably will not go more than a bar or two either way before it reverses again.
Reversing down from above a bull channel
There is one important factor that makes a pullback likely. I have written every week for 6 months that the monthly chart has been at the top of a bull channel. I have said that a breakout above a bull channel fails 75% of the time within about 5 bars. February is the 3rd bar, and there is a micro double top with the January high. While the Emini might go a little more sideways to up, traders should expect it to reverse down for at least a couple months. It looks like it will reverse down in March.
When there is a reversal down from above the top of a channel, many bears look for it to fall to the bottom or about the middle of the channel. The chance of reaching the bottom is small in 2021. However, the middle is around 3,200, which is at the October low, and it is a 20% correction. At the moment, there is a 60% chance of a selloff in the next few months to below the September high of 3,568.50 and a 30% chance of a selloff to 3,200 before there is a new high.
The Weekly S&P500 Emini futures chart is reversing down from above 2 bull channels
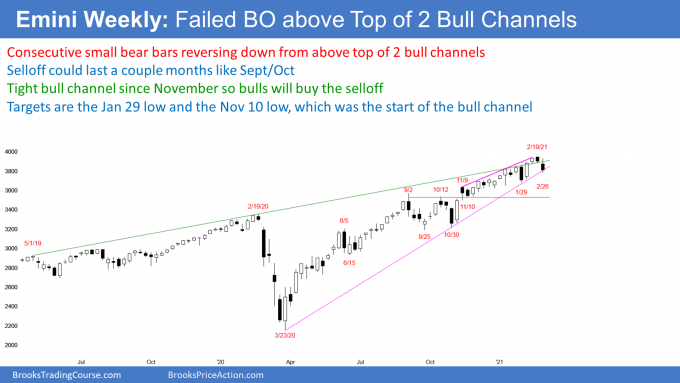
The weekly S&P500 Emini futures chart formed a 2nd consecutive bear bar this week. This is the 1st time this has happened since early November. But neither bar was particularly big, and therefore traders have not yet decided to sell aggressively.
The Emini also reversed down from above the bull channel. There are two ways to draw the channel. I have been saying that the break above the bull channel that began 2 weeks ago, would likely reverse down within 5 bars (weeks). That is what typically happens when there is a breakout above a bull channel. This week is the reversal.
The 1st target is the bottom of the channel. But since the wedge up from May 2019 is now very tight, the bull trend line at the bottom of the channel is only a little below the top of the channel. This week already reached that initial downside target.
The Emini is now back in January’s 5-week trading range. A tight trading range late in a bull trend, is often the Final Bull Flag. Back in January, I said that the trading range was likely going to be the final flag.
The reversal down into the trading range does not mean that a bear trend has begun. When there is a final flag reversal, the market usually tests the bottom of the flag, which is around 3,650. At that point, traders decide whether the Emini will resume up, or fall to the next support. The next support is at the start of the bull channel that began on November 10, and that low is around 3,500.
Still in a Small Pullback Bull Trend
The yearlong bull trend has been a Small Pullback Bull Trend. All of the pullbacks have been small. The bulls hope that this one only lasts a couple weeks, and that the rally continues up above 4,000. But since there is a parabolic wedge buy climax, and consecutive bear bars reversing down from the top of the channel, there is a 60% chance that the Emini has begun a bigger pullback, like in September and October.
Because the reversal is coming from a parabolic wedge buy climax, it could last about 10 bars (weeks) and have a couple legs sideways to down. But that is not a bear trend. The best the bears will probably get is a trading range. If there is a trading range, and it lasts 10 or more bars, then the bears would have a 40% chance of a trend reversal down. Until then, the chance of a bear trend on the weekly chart is only 30%. Traders are planning to buy the 1st reversal down, expecting at least one more new high.
The Daily S&P500 Emini futures chart finally has strong consecutive big bear bars so 10% correction likely
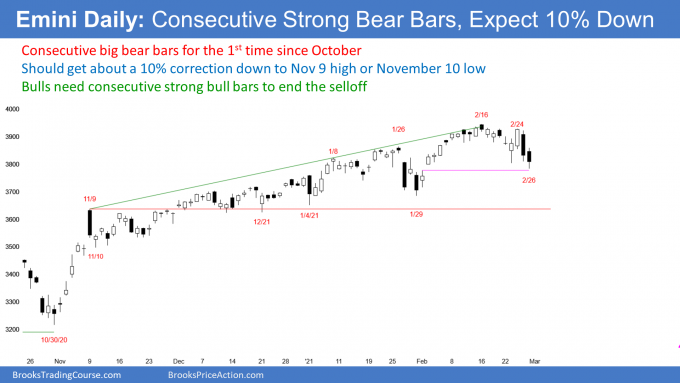
The daily S&P500 Emini futures chart has been in a strong bull trend for a year. The bulls bought every selloff. From late October to mid-February, no pullback fell more that 3 days. Traders bought each one and their buying soon led to a new high. But some things have changed, and there is now a 60% chance that the Emini will fall further before the bulls come back
It is important to note that the Emini has been sideways for the past month, and it has been working lower since February 16. This is the 1st pullback since October that has fallen more than 3 bars (days).
Will the bulls buy the pullback next week? Every time there has been a big bear bar since late October, the bulls bought it and the bull trend resumed. However, this is the 1st time since the 10% corrections in September and October, when the day after a big bear day also had a bear body. That makes it likely that the Spike and Channel Bull Trend that began in November, is finally transitioning into a trading range. The current selloff should only be a bear leg in what will be a trading range, but the bottom of the bear leg will probably be about 10% down. It could retrace the entire rally, which began On October 30 at around 3,200.
What magnets are pulling the Emini down?
Look at the strong reversal down on November 9. That high was just below 3,650. There were 2 more tests of that high over the next 2 weeks, and the Emini turned down both times. Then the Emini broke above it. There were several tests back down to it in December and January. The chart is telling traders that it is an important price. It is therefore a logical magnet for the current selloff.
If the Emini gets there, the next magnet is just a little lower. The rally to November 9 was a breakout, which I call a spike up. The rally from November 10 was a bull channel. Once there is a reversal in a Spike and Channel Bull Trend, and the Emini appears to be reversing, it often goes all of the way down to the start of the bull channel. That is the November 10 low at 3,500. If the Emini gets there, there would be a 10% correction.
Summary of what to expect in March
There is a 40% chance that the Emini will soon make a new high. The odds will favor a new high if the bulls get a couple consecutive strong bull days. Now, there is a 60% chance that the Emini will test the January 29 low and maybe the November 9 high, between 3,650 and 3,700. There is a 50% chance of the selloff reaching the November 9 low at 3,500, and a 30% chance of a 20% correction down to the October 30 low at 3,200.
Trading Room
Traders can see the end of the day bar-by-bar price action report by signing up for free at BrooksPriceAction.com. I talk about the detailed Emini price action real-time throughout the day in the BrooksPriceAction.com trading room. We offer a 2 day free trial.
Charts use Pacific Standard Time
When I mention time, it is USA Pacific Standard Time (the Emini day session opens at 6:30 am PST, and closes at 1:15 pm PST). You can read background information on the intraday market reports on the Market Update page.


Al, are not the 30Y Bond Futures giving us a signal of rising interest in the highest part of the yield curve and therefore a rise in the inflation making west countries debt unsustainable? What are your thoughts about.
Sincerely yours
Juan Delgado
That is why the stock market will probably be in a trading range for 10 year.
EURUSD monthly. Do you conclude the 7 bar breakout above the bear trend line was successful (did not fail with around 5 bars)? If the bear trend line remains intact, why is that, or when would you redraw a broader bear channel given the last 7 bars?
Can you discuss any long term, 5 -10 year price action outlook you have (like you do for bond futures) for a weaker or stronger dollar that includes any economic or political fundamentals that in your view, could affect EURUSD?
Thank you very much for the time you take to explain technical analysis and for sharing your macro perspectives.
The monthly chart has been in a trading range for 6 years. The 2017 reversal up was strong enough to have a 2nd leg up. This is the 2nd leg up. But there is no reason to believe that the trading range is the start of a trend. Trading ranges can last a long time. Until there is a breakout, there is no breakout.
Is the 2020 rally the start of a bull trend on the monthly chart? Most trading range breakout attempts fail. I therefore am not as bullish as everyone else in the world. Maybe a little bullish for the next year, but there is no reason yet to be bullish for 5 or 10 years. Is anyone bearish?
People like to get on TV, so they confidently will say anything, hoping they will end up being right. The market would not still be in a trading range if most smart money thought that the EURUSD was going a lot higher… it would be breaking far above the 2018 high.
When a market goes up, all the TV experts play the game of creating cleaver, plausible explanations why this is a new bull trend. But this is sophistry. The charts, and therefore the smart money, do not agree with those clowns, at least not yet.
Until I see a couple bars on the monthly chart closing above the 2018 high, and preferably far above, it is more likely that the EURUSD will stay in the trading range. It has been sideways for 6 years. Why not another 6 years? Why not a bear breakout? Show me the bull breakout and then I will agree.
Dear Al,
Emini,
On Monday, if the bears could not close the Feb 2 gap, would it be enough to expect last week’s TR to continue or the bull trend resume? Or it should typically be a magnet and closed?
Thank you.
The Titanic is going down, even if the party lasts a little longer.