Monthly S&P500 Emini futures candlestick chart:
Protracted buy climax
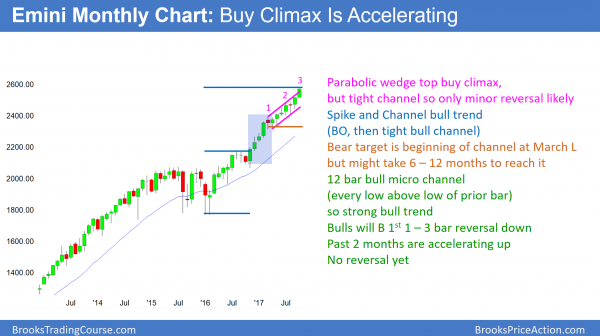
Every bar for the past 11 months has a low above the low of the prior month on the monthly S&P500 Emini futures candlestick chart. This is therefore a 12 bar bull micro channel. Although this means the bull trend is strong, it is also a buy climax. The past 2 months are accelerating upward. While it could be a measuring gap, it will more likely be the start of a blow-off top.
The monthly S&P500 Emini futures candlestick chart is in 12 bar bull micro channel. The only time in the past 50 years when the monthly S&P500 cash index had a longer bull micro channel was in 1995. That micro channel lasted 13 months. The pullback lasted only one month, and it was about 4%. The bull trend then continued up 4 fold over the next 5 years.
While the current rally will almost certainly not quadruple over the next 5 years, the pullback will probably be comparable to the one in 1995. Therefore, the odds favor about a 5% pullback before the current micro channel lasts much longer.
Theoretically, there does not ever have to be a pullback. However, that is not how markets behave. Since it is now showing extreme behavior, it is likely to do what it has always done before it becomes much more extreme. The odds therefore favor a 1 – 3 month pullback beginning within the next few months. Since the bull trend is so strong, the bulls will buy the pullback. This is true even if it lasts a year and falls 20% from the high. The bears would need a reversal at least that big before traders would begin to conclude that the bull trend had ended.
Weekly S&P500 Emini futures candlestick chart:
Continuing buy climax
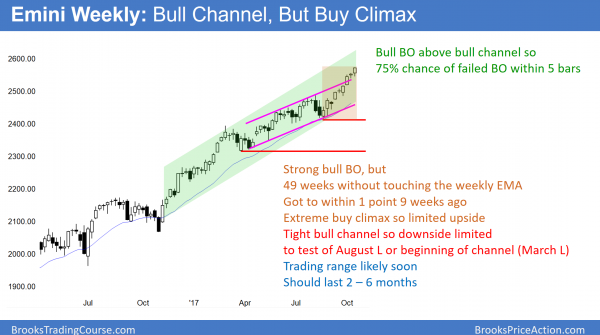
The weekly S&P500 Emini futures candlestick chart has not touched the 20 week exponential moving average in 49 weeks. This is a very strong bull trend, but overbought.
The weekly S&P500 Emini futures candlestick chart has been above its 20 week moving average for 49 weeks. This has never happened in the 18 years of the Emini. In 2003, it stayed above for 48 weeks and finally touched on the average on the 49th week. It then entered a trading range for the next 10 months. Furthermore, the bottom of that range was 10% below the high.
Although the weekly chart can stay above its average price indefinitely, the basis of technical analysis is that the charts are a reflection of rational human behavior. Since the current behavior has to be rational, it is unlikely to deviate from past behavior for too long. Consequently, the odds are that the Emini will soon begin to go sideways to down to its average. To get there quickly, it would have to fall at least 80 points.
More likely, once it begins to pull back, it will take several weeks to get there. That would require only about a 50 point drop from the high. However, it will probably fall at least 20 – 50 points below the average after being so far above it for so long. That means that the pullback will probably be 100 – 150 points. However, there is no top yet, and until there is a strong reversal down, the odds favor higher prices.
Daily S&P500 Emini futures candlestick chart:
Buy climax at 30th anniversary of 1987 stock market crash
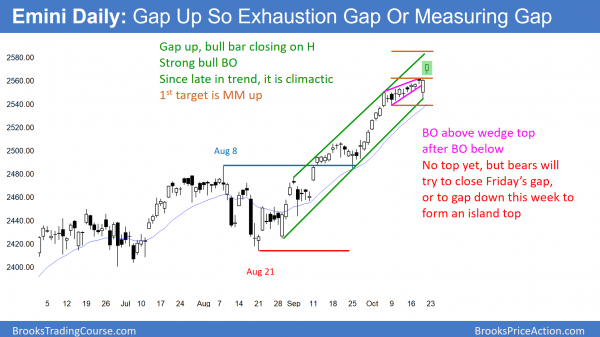
The daily S&P500 Emini futures candlestick chart was in a wedge bull channel for 2 weeks. After breaking below it on Thursday, it reversed up. It then gapped up to a new all-time high on Friday. The next target is a measured move up, based on the height of the wedge.
The daily S&P500 Emini futures candlestick chart broke below a small wedge top on Thursday, but immediately reversed back up. It gapped up to a new all-time high on Friday. The bulls want strong follow-through buying and at least a measured move up, based on the height of the wedge.
The bears want the rally to a new high to fail, and then they want a break below Thursday’s low. That low is a major higher low because it led to a strong reversal up to a new high. A break below would convert the bull trend into either a trading range, or possibly a bear trend.
When there is a gap up, the Emini often goes sideways for a few days. The bulls see the small range as a bull flag, but the bears see it as a potential island top. Because Friday closed on its high, it will probably go at least a little higher before there is a 2 – 5 day pause. Then, the Emini will again decide between a reversal down or higher prices. Since most tops fail, the odds always favor higher prices. Yet, because the buy climaxes are so extreme on the weekly and monthly charts, the odds of a reversal are increasing.
Blow-off top?
Because of the extreme buy climaxes on the weekly and monthly charts, there is an increased risk of a blow off top. By this, I means a very strong, brief rally that reverses down violently. This rarely happens, but when it does, it usually comes when the Emini is already in a buy climax, like now.
Whenever there is an extreme buy climax, there is always an increased chance of one or more big bear days coming at any time. If that happens, it can be the start of a correction that can last 20 or more bars. Since the buy climaxes on the weekly and monthly charts are extreme, when there is a correction, the Emini might go sideways for many months. However, until there is a strong reversal down, the odds are that the buy climax will continue to get more climactic.
Gap up in buy climax so possible island top
Whenever there is a gap up to a new high, there is a buy climax on the daily chart. That means that there is an increased chance of a reversal down. This is especially true because the weekly and monthly charts are also in buy climaxes.
If the Emini gaps down within the next couple of weeks, that gap down would create an island top with Friday’s gap up. This would slightly increase the odds of a correction, but most tops fail. Therefore, the odds are that an island top would lead to a minor reversal. However, the Emini has never been this overbought in its 18 year history. In addition, the S&P cash index has only been this extreme once in the past 50 years. Hence, there is an increased chance of a 100 point, 5% correction beginning in the next few weeks. Yet, until there is a strong reversal down, the odds continue to favor higher prices.
Instead of gapping down, sometimes the Emini trades down and closes the gap. This would happen if the Emini fell back below Thursday’s high. That gap then becomes an exhaustion gap. It has the same significance as an island top.
30 years after the 1987 stock market crash
I remember being heavily short that morning 30 years ago. I sold 13 full-size (there were no “minis” back then) S&P futures contracts early that day, which is the equivalent of 65 Emini contracts today. Yes, the price was much less, but it was still a good position, given how volatile the market was and how I was a new trader. Since I had a full surgery schedule that day, I had to close out my position early so that I could go to the operating room.
As I was driving to work, I listened to the radio and heard that the stock market was collapsing, but all of the stations said that it was impossible to know how far down it was. The technology could not keep up. There were no bids. No one was buying, and that made it impossible to go short once the selling began. Anyone who bought was stuck with their position for the entire day. Remember, someone has to buy from you for you to go short, and there were zero buyers. None. At the end of the day, the Dow was down 22% and I think the S&P fell 26%. It was the biggest one day crash in history. In fact, it was even bigger than the 1929 crash, although that one continued down for a few years and the Dow ultimately lost about 90%.
Would a beginner manage his trade well during a crash?
Had I been able to stay home, and had I held until the close, I would have made $400,000 that day. That would be about a million dollars in today’s money. Even if I made that money, I was a beginner back then. I therefore probably would have given a lot of it back over the next few weeks because there were several extreme reversals. I probably would have bought high and sold low, and lost money. However, it is fun to think back to that time.
Will it happen next week? Rare things are rare because they rarely happen. To bet that a rare thing will happen is a low probability bet. Therefore, the odds of a crash anytime soon are tiny, despite the current buy climaxes.
Traders can see the end of the day bar-by-bar price action report by signing up for free at BrooksPriceAction.com. I talk about the detailed Emini price action real-time throughout the day in the BrooksPriceAction.com trading room. We offer a 2 day free trial.
When I mention time, it is USA Pacific Standard Time (the Emini day session opens at 6:30 am PST, and closes at 1:15 pm PST). You can read background information on the intraday market reports on the Intraday Market Update page.


Thanks Al, I really enjoy your weekly analysis. It adds to your video series. Privileged to have such a great mind with us. So often before a trade I will ask myself “Would Al bid here?”, and it stops me from doing silly trades!
Al,
Thank you for the weekend update. A quick question for you if you don’t mind.
John Templeton once said “bull markets are born in despair, rise in pessimism, mature in optimism, and die in euphoria.”
Do you feel the price action we are seeing lately could be categorized as “euphoric”, as in possibly the blow-off top stage of this 8 year bull market?
On an eye level, the buying we are seeing lately in the emini seems to be even more relentless than it was 1999, in terms of nearly every day closing green, without pulling back (which I believe you have previously alluded to in your weekend updates).
If you do feel that this buying is euphoric, do you think that we are at risk where the selling could be much greater than most are anticipating once this buy climax finally concludes (example Chinese stock market in 2015 after it’s buy climax).
Thank you very much.
Everyone is enjoying this rally because it is fascinating and profitable. People naturally are drawn to challenges. It is in our genes, and it is a survival quality. The cliche, “Only the strong survive” has some merit. That is why wars, sports, danger, exploration, the unknown, and trading are so intriguing. We enjoy the thrill of flirting with death and then surviving. Churchill once said, “Nothing in life is so exhilarating as to be shot at without result.”
One of the things about trading that is especially fun is the unknown and the breathtakingly dramatic reversals up and down that occur on all time frames. Since everyone sees the buy climaxes on the daily, weekly, and monthly charts, they are especially attentive to what is now unfolding. Everyone knows two things. First, the rally will not last forever. Second, it can last much longer than what most people thinks is possible.
You quoted Templeton, but countless others have made similar comments over the years. Every old, famous trader feels important enough to create a similar quote. It is as if he wants everyone to believe he discovered the concept. It’s like you telling me that you discovered water or air. For example, Buffet says, “Be fearful when others are greedy and greedy when others are fearful.”
As you know, I talk about tight channels and reversals all of the time. When a bull trend is in a breakout, like on the monthly chart, or in a tight channel, like on the weekly chart, there is an 80% chance that any reversal will be minor. Therefore, there is only a 20% chance of this buy climax turning into a bear trend without going sideways for at least 10 or more bars on the weekly chart.
I don’t have time here to discuss the different types of reversals, like parabolic wedge tops and endless pullbacks. However, I have been saying for months that this rally is climactic, and the odds continue to favor higher prices until there is a credible top. Since most tops involve at least small trading ranges, the downside risk over the next few months is small.
As I wrote this week, even if the bears get a 20% correction, the bulls will buy it. This is because the bulls know that the best the bears can get is a trading range over the next many months. This means that even a strong selloff would much more likely be a bear leg in a big trading range than the start of a bear trend.
Let me return to your question. Yes, this is a buy climax, but buy climaxes usually lead to a pause in a bull trend, not a bear trend. The pause is a trading range. Once there is a trading range, then the bears have a 40% chance of a trend reversal. I have mentioned many times that because this climax is so extreme, there is an increased chance that the trading range that follows could be deeper and last longer than that people on TV say. However, the odds still favor some kind of trading range rather than an instant bear trend. Sometimes there is a sharp selloff and then a rally to a lower high major trend reversal. That is a type of double top and therefore a type of trading range.
I’m not sure I can agree with your statement that “the weekly chart can stay above its average price indefinitely”. Unless there is a nonlinear acceleration, price will become the average once it exceeds the sample number N.
Can a chart stay above its 20 bar average forever without accelerating up in a parabolic climax?
I agree that everything has to hit “average” at some point in the real world. This is because there is always eventually going to be a major news event that would create a selloff that was big enough to fall below the average. Therefore, I specifically chose the word “indefinitely” instead of “forever.” I want readers to understand that the chart can stay above an average price for much longer than what seems logical when one thinks about what an average is.
I have given this some thought over the years, but I have never spent time doing the math. However, from a mathematical perspective, I believe “forever” is correct. The 20 week exponential moving average is based on closes, and it uses almost exclusively those of the past 20 weeks. This week’s close replaces the close of 21 week ago.
The candlestick bars on the weekly chart show every price during every week. Can those bars stay above the 20 week average forever without accelerating upward in a parabola? Instead of a candle stick chart, use a line chart, which simply connects closes and is therefore a 1 bar moving average. The question is, can a 1 bar average stay above a 20 bar average without acceleration?
Let’s look at a bull trend that keeps going up at the exact same rate every week. Let’s say that every week closes 1 point above the close of the prior week. The rate of change (which is the slope of the line and also the velocity) is constant and therefore there is no acceleration. Both the 1 week and 20 week moving averages are increasing at 1 point per week. Both lines are straight and sloped up at exactly the same angle, and therefore parallel.
The 20 week average lags (is lower) because it is held down by prices that go back 20 weeks, and those prices are lower. A 1 bar average is based only on this week’s close. It therefore only “averages” this week, which is higher than each of the the 19 prior closes. It therefore remains above the average of the past 20 bars. Although I might be missing something, this makes me conclude that a chart (candle stick or line), which is always a 1 bar average, can stay above its 20 bar average forever without accelerating.
Mathematically Al is correct in this case. If every week opens at the close and moves up 1 point and closes there, the moving average would never be touched, not a SMA and not an EMA.
Al, I remember from one of your video’s that the stock market crash of ’87 made you decide to become full time trader. So happy anniversary!
Intriguing questions & profound answers ….. thank you both
One day I will quote you somewhere Al … I really enjoyed this insight …
“The basis of technical analysis is that the charts are a reflection of rational human behavior. Since the current behavior has to be rational, it is unlikely to deviate from past behavior for too long”.