Market Overview: Nifty 50 Futures
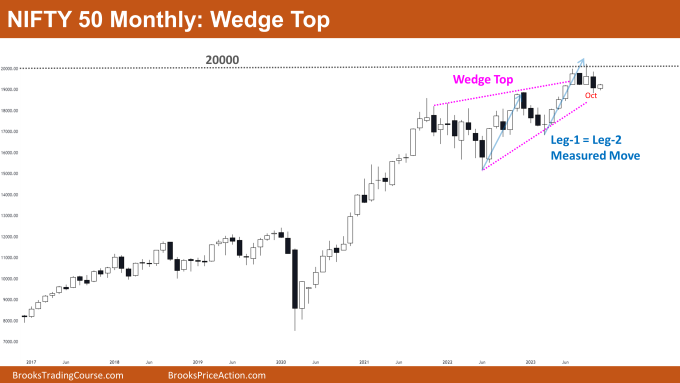
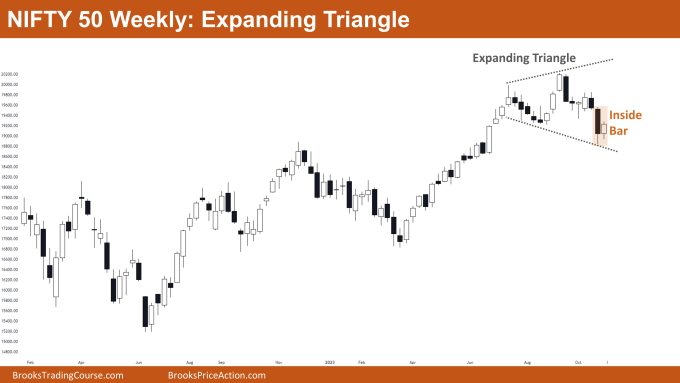
Nifty 50 Wedge Top on the monthly chart. The market continued to be in a wedge top breakout mode even after it provided a bear close for the October monthly bar. The big round number 20000 represents a strong resistance on the monthly chart that the Nifty 50 is trading below. This could marginally increase the likelihood of a bear breakout of the wedge top. Near the bottom of the expanding triangle, Nifty 50 has created an inside bar pattern on the weekly chart. The inside bar pattern’s strong bear bar increases the likelihood of a brief second leg down before an upswing reversal.
Nifty 50 futures
The Monthly Nifty 50 chart

- General Discussion
- For the past three months, the market has been trading around the same levels.
- The market is about to break out from the wedge top, so traders should hold off on taking on new positions until the market breaks out.
- Before cutting their long positions, bulls who are already in a long position should wait for a bear breakout attempt of the wedge top.
- Deeper into the price action
- The wedge top pattern’s second leg up is a strong bull leg, which increases the likelihood of a tight trading range rather than a strong bear breakout.
- When the market is trading close to a large round number—20,000 in the example above—traders should expect trading range price action and trade accordingly (i.e., scalp, not swing).
- Patterns
- Market is facing a strong resistance at 20000 level because many bulls are exiting near the measured move level of the leg-1 = leg-2 pattern.
- A wedge top is one kind of channel; the likelihood of a successful bull breakout is 25%, and the likelihood of a successful bear breakout is 75%.
The Weekly Nifty 50 chart

- General Discussion
- Traders can buy at the inside bar’s high while the market is trading close to the bottom of the expanding triangle pattern.
- Given the strength of the bear bar and the decreased likelihood of a quick leg up, some traders may choose to hold off on buying until a strong bull close.
- If the market exhibits a robust bear breakout of the expanding triangle, traders may choose to short the market.
- Deeper into price action
- The market has formed both strong bull and bear legs, as shown by the bars on the left, but it has never been able to follow through on either one.
- Since this indicates trading range price action, traders should scalp their trades—that is, book quick gains or losses—instead of holding a position for a swing trade.
- Patterns
- Since the market is moving inside an expanding triangle, traders should concentrate on buying close to the triangle’s bottom and sell close to its top.
- The market is also developing an inside bar pattern; depending on the height of the large bear bar, a bear breakout from this pattern may result in a measured move down.
Market analysis reports archive
You can access all weekend reports on the Market Analysis page.

