Market Overview: Weekend Market Analysis
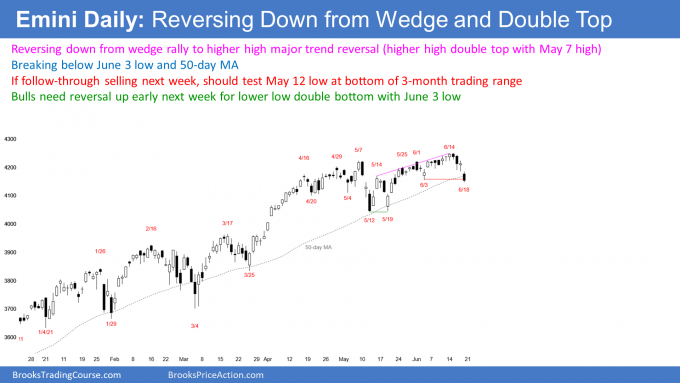
The SP500 Emini futures market is reversing down on the daily chart from a wedge rally to double top (higher high) with the May high. If the bears get follow-through selling next week, the rally will test the May low.
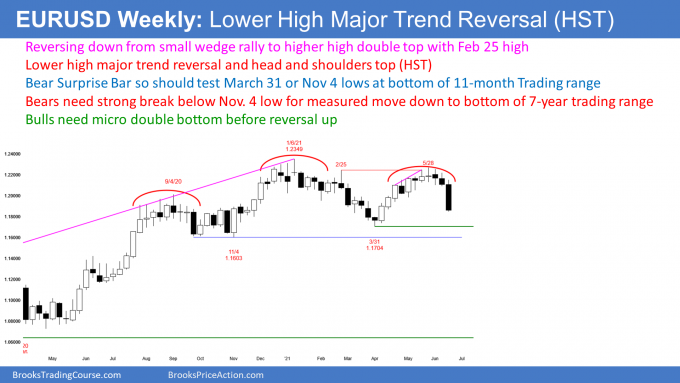
The EURUSD Forex market on the weekly chart is reversing down from a head and shoulders top. The selloff should test the November low at the bottom of the 11-month trading range.
EURUSD Forex market
The EURUSD weekly chart

- I have repeatedly made the point, that despite how bullish everyone on TV has been, the EURUSD has been at the top of a 7-year trading range on the monthly chart, and most attempts to break out fail.
- I also said that the EURUSD was at the top of an 11-month trading range on the weekly chart, and that made a reversal down more likely than a successful breakout above.
- This week formed a big bear bar. It was caused by disappointed bulls exiting their longs in a panic (a Give-up bar). It was also a Bear Surprise Bar.
- Surprise Bar means low probability. While it was likely that the EURUSD would turn down at some point, it was unlikely that any particular week would turn down and form a big bear bar.
- A low probability bearish event traps bulls in and bears out.
- Some bulls did not exit, and are now hoping for a bounce, so that they can sell out with a smaller loss.
- Some bears did not short, and they want a bounce that will allow them to short with less risk.
- With both bulls and bears looking to sell the 1st rally, the odds are there will be a 2nd leg sideways to down.
Bear Trap or a selloff to the November low?
- Can the bear breakout be a bear trap (a failed breakout that reverses up)? Any breakout can be a trap. Unless next week is a bull bar closing near its high, there will be a 60% chance of at least a small 2nd leg sideways to down over the next few weeks.
- If next week is a big bear bar closing on its low, the odds of a 2nd leg down will be about 70%.
- How far down can the selloff go? The obvious 1st target is the bottom of the 11-month range. That is either the November 4, or March 31 lows, around 1.16 and 1.17.
- The bulls want a higher low, so that the EURUSD would still be in a bull channel. The March low is above the November low.
- The bears want a strong break below both of those lows. They would then want a measured move down to the bottom of the 7-year trading range, which is last year’s low at around 1.03.
- What is most likely? I keep saying that trading ranges resist breaking out. Therefore, if the EURUSD reaches the bottom of the 11-month range, which is likely, it would then probably go sideways to up for several weeks. Traders would need time to decide if it will break below, or go back up to the middle or top of the range.
S&P500 Emini futures
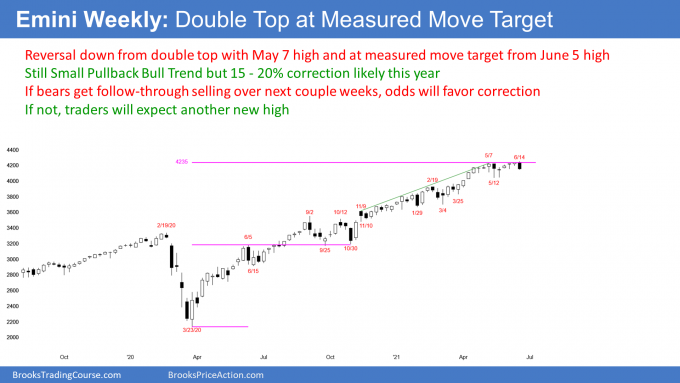
The Weekly S&P500 Emini futures chart

- I have been talking for months about the measured move target based on the June 5 high, and then the September 25/October 30 double bottom test of that high. The Emini has stalled at the target for a couple months.
- This week broke above it and reversed down. It is to early to know if the reversal will be a pause, that will lead to another attempt to break above this resistance. Or, if the resistance will hold and the bulls will take profits, leading to a correction.
- This week traded above last week’s high, and made a new all-time high. It then sold off to below last week’s low. This week is therefore an outside down week, which is bearish.
- This week closed below last week’s low. That increases the chance of lower prices next week.
- Because it closed near its low, next week could gap down on the weekly chart. If the gap stayed open, it would further increase the chance of lower prices.
- The bears see this week as a sell signal bar for a double top with the May 7 high.
- The bar after an outside bar frequently has a lot of overlap with the outside bar. It often is an inside bar. Therefore, the outside bar might not be as bearish as some might think. The bears need sustained selling to convince traders that a reversal is underway.
- I keep making the point that the weekly chart has been in a Small Pullback Bull Trend for over a year. That is a type of strong bull trend. Most reversal attempts in a strong trend fail, and become bull flags.
- A Small Pullback Bull Trend usually gets a big pullback after about 60 bars. Therefore, that is likely within the next couple months. The Emini would then no longer be in a Small Pullback Bull Trend.
- A strong bull trend only has a 30% chance of immediately reversing into a bear trend, without first evolving into a trading range. Therefore, the 1st reversal down might be big enough to end the strong trend, and possibly lead to a swing down, but it should not continue down into a bear trend.
How low can this go?
- How big a pullback is needed to end a Small Pullback Bull Trend?
- Traders should expect a pullback that is bigger, and lasts longer than any prior pullback in the trend.
- The biggest pullback was 10% in September and October. Therefore, traders should expect a 15-20% pullback to begin within the next couple months.
- Once a pullback reaches 10%, it has a 50% chance of eventually falling 20%.
- Traders will buy the selloff, because they know that even a strong reversal down in a strong bull trend, will likely reverse back up and test the high.
- Is this week the start of a 20% pullback? While a 15-20% pullback is likely at some point this year, picking the exact start is a losing bet. It is always more likely that every reversal down will be brief, and the bull trend will resume. Therefore, this selloff will probably not be the end of the strong bull trend.
- For traders to conclude that the strong bull trend is over, they need to see strong, sustained selling. By the time that happens, the correction is usually already half over.
The Daily S&P500 Emini futures chart

- I have been saying for many months that Fed Chairman Powell was wrong to say that the Fed would not raise rates until at least 2023. There are far too many variables beyond his control to make that statement, and making it hurt his credibility.
- The recent CPI reading of 5% was too much to ignore. To restore some credibility, he was forced to change his statement this week. That resulted in Wednesday’s selloff after the FOMC announcement.
- I still think what he is saying is wrong, and that he will be forced to raise rates next year.
- Is he lying, or just trying to reassure the markets? To me, it’s a lie because he should know better. But it does not matter. If enough institutions think inflation will rise faster than what Powell continues to say, that will reduce the upside for the markets over the next couple years.
- Why did the market not continue to sell off on Wednesday, after a change in Powell’s position? Traders already knew that Powell had to change his statement, and that was already factored in.
- There was a reflexive selloff when he made the announcement, but no follow-through selling until Friday. The bears quickly bought back their shorts on Wednesday, and the bulls bought the brief discount.
- It is important to note that bear trends often have strong rallies, like after the FOMC announcement on Wednesday, and again on Thursday. They are bull traps, tricking eager bulls into buying in a bear trend, hoping that the old bull trend is intact.
- Those eager bulls get overwhelmed by bears who are waiting for strong rallies to sell, confident that the market will go lower in a series of lower highs and lows.
Wedge rally to higher high double top, but strong bull trend
- Tuesday made a new all-time high but reversed down.
- The rally from the May 12 low is a wedge bull channel, which often attracts profit-takers. The shape is not good, and it therefore might not have attracted as many sellers initially as a more typical wedge would. However, if the bears get persistent selling over the next couple weeks, traders will conclude that a correction is underway.
- The reversal is also a higher high double top with the May 7 high. It is therefore a higher high major trend reversal.
- A major trend reversal with a reasonable sell signal bar, like on Tuesday, has a 40% chance of leading to a swing down.
What is the difference between a swing down and a bear trend?
- Note that I did not say a 40% chance of a bear trend. I said a swing down. A swing means at least 2 legs sideways to down, and about 10 or more bars.
- The stronger the selloff, the higher the probability that a swing down will grow into a bear trend, which is a series of lower highs and lows.
- If the bears get a couple big bear bars closing near their lows or 3 – 5 bear bars mostly closing below their midpoints, the probability of a bear trend would be 40%.
- At the moment, traders expect at least a 2nd leg sideways to down.
- There is only a 40% chance that it be a swing down, and not just sideways.
- The probability that this is the start of a bear trend is currently only 30%.
What is the difference between a bear trend and a bear market?
- The definition of a bear trend is based on a chart. It is a series of lower highs and lows.
- Institutions and the media talk about bear markets and not bear trends.
- A bear market is a 20% drop from the high, which can happen without a bear trend (a series of lower highs and lows on a chart).
- For example, a single bear bar in a strong bull trend on the monthly chart, can have a low that is 20% down from the high. The media would call it a bear market, even though it was only a one-bar pullback in a bull trend.
What about next week?
- There is a seasonal tendency to go sideways to down in the middle of June, and then up from June 26 to July 5. The math is not good enough to use this to trade, but traders should be prepared for a rally at the end of the month, which is also the end of the quarter.
- Wednesday’s FOMC announcement created a big bear bar on the daily chart.
- Thursday had a small bull body, and it was therefore a weak follow-through bar for the bears.
- However, the bears got strong follow-through selling on Friday. It gapped down and closed on the low, and below the 50-day MA and the June 3 low.
- Also, this week’s low was exactly at a 50% retracement of the May 19 to June 14 rally
- Another support level is the bull trend line from the October 30 low — a magnet just below Friday’s low.
- Because the Emini is at a cluster of support, the bulls will try to stop the selling next week. They then would try to rally back up to a new high, after that seasonally bullish window begins on June 26 (next Saturday).
- Traders will find out over the next couple weeks, if this selloff is the start of a swing down or bear trend. It currently is more likely that will be just another pullback in the yearlong bull trend.
- However, the selloff has been strong enough, so that traders will sell the 1st bounce, expecting at least a small 2nd leg sideways to down.
- If the Emini continues down strongly early next week, the odds will shift in favor of a test of the May low, and the 4,000 Big Round Number.
Trading Room
Traders can see the end of the day bar-by-bar price action report by signing up for free at BrooksPriceAction.com. I talk about the detailed Emini price action real-time throughout the day in the BrooksPriceAction.com trading room. We offer a 2 day free trial.
Charts use Pacific Time
When I mention time, it is USA Pacific Time (the Emini day session opens at 6:30 am PT, and closes at 1:15 pm PT). You can read background information on the intraday market reports on the Market Update page.


Option traders see more volatility ahead. The expected move for next week is more than 30 SPX points higher than last week.