Monthly S&P500 Emini futures candlestick chart:
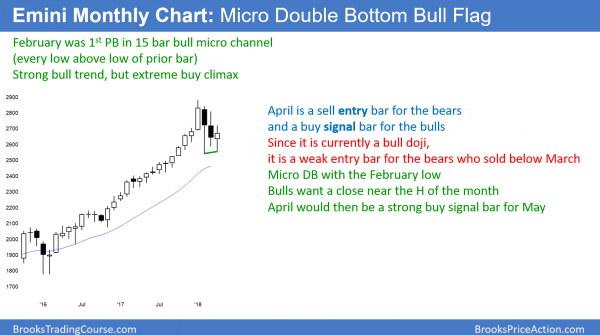
April is reversing up after a 3 month bull flag
The monthly S&P500 Emini futures candlestick chart so far this month has a bull reversal bar. If it closes near its high, it will be a strong buy signal bar for May.
The monthly S&P500 Emini futures candlestick chart reversed up in April, as I have been saying was likely. There are still 6 trading days left, and there is plenty of time left for a strong reversal back down. However, after a 15 month bull micro channel, the odds have been for a bull flag that would end by the 3rd month. So far, this looks to be the case.
But, because the stock market has never been as overbought in its 100 year history as it was in January, the correction could last 6 months. There is still only a 20% chance of a bear trend on the monthly chart without at least a small double top.
Weekly S&P500 Emini futures candlestick chart:
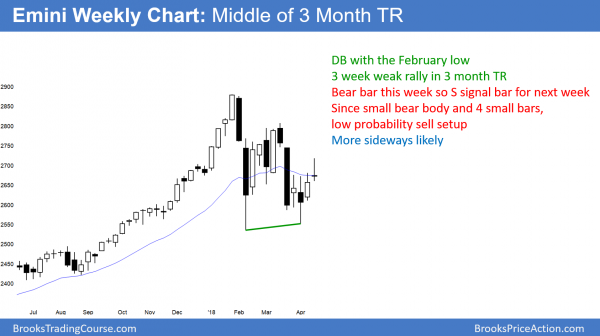
Weak Emini breakout above 2700 Big Round Number on strong earnings
The weekly S&P500 Emini futures candlestick chart had a bear doji this week. It is a weak sell signal for next week.
The weekly S&P500 Emini futures candlestick chart has been in a tight trading range for 4 weeks. It is also in the middle of a 3 month trading range. This means that it is searching for direction.
This week was a doji bear reversal bar, which is a weak sell signal for next week. Consequently, next week will probably be another small bar, similar to the past 4 weeks.
Because there was a strong bull trend prior to this 3 month trading range, the odds still favor a bull breakout. However, the weekly chart needs consecutive strong trend bars up or down before traders believe that the trading range is converting into a trend.
Daily S&P500 Emini futures candlestick chart:
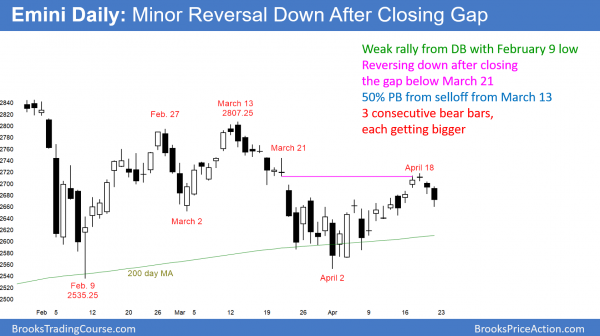
Pullback from weak breakout above 4 week island bottom
The daily S&P500 Emini futures candlestick chart is pulling back from a breakout above a four week island bottom. The bears, however, have 3 consecutive bear bars. If the selling continues next week, the chart will test the April low.
The daily S&P500 Emini futures candlestick chart gapped up this week. This therefore created a 4 week island bottom. Also, the April low formed a double bottom higher low with the February low.
However, it gapped back down on Thursday and therefore created a 2 day island top. In addition, it did so after a 50% retracement of the March selloff. Furthermore, it is reversing down after closing the gap below March 21. Finally, the past 3 days had bear bars and the bodies are getting bigger. This means that the momentum down is accelerating. That increases the chance of at least a small 2nd leg down.
Island tops and bottoms are common in trading ranges. The 4 week island bottom was bigger than the island top. In addition, if followed a double bottom with the February low. Furthermore, the monthly chart is in a strong bull trend. Consequently, the odds favor a test of the March high above 2800 over another test of the February low.
Traders can see the end of the day bar-by-bar price action report by signing up for free at BrooksPriceAction.com. I talk about the detailed Emini price action real-time throughout the day in the BrooksPriceAction.com trading room. We offer a 2 day free trial.
When I mention time, it is USA Pacific Standard Time (the Emini day session opens at 6:30 am PST, and closes at 1:15 pm PST). You can read background information on the intraday market reports on the Intraday Market Update page.


