Monthly S&P500 Emini futures candlestick chart:
Strong rally, but parabolic wedge top likely
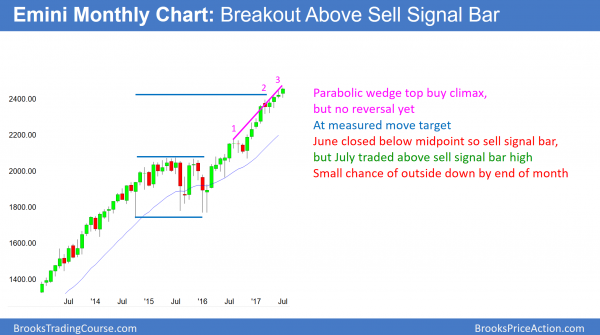
The monthly S&P500 Emini futures candlestick chart currently has 4 consecutive bull trend bars. However, the rally is also a parabolic wedge buy climax.
The monthly S&P500 Emini futures candlestick chart is in a parabolic wedge buy climax. Yet, the momentum up is strong enough to reach the next major resistance of the 2500 Big Round Number.
April was a High 1 buy signal bar. In addition, it followed a 4 month buy climax. Furthermore, it was at the resistance of a measured move up from the 2014 – 2015 trading range. A rally from a High 1 after a buy climax and at resistance usually lasts 1 – 3 months and then leads to a pullback for several bars (here, months). Since July is the 3rd month of the rally, the odds are that the Emini will begin to pull back for a few months in July or August.
June is a sell signal bar because it closed below its midpoint. While the bears are running out of time in July, they still can trigger the sell this month by trading below the June low. If the Emini trades down from above June’s high to below June’s low, July would be an outside down month. This would increase the chances of a 3 month pullback.
Exhaustion gap or measuring gap?
What about the bulls? How long can this rally last without a pullback? This 17 month rally is the strongest leg in the 7 year bull trend. The current rally is a 9 bar bull micro channel. This means that the low of every month is at or above the low of the prior month. When a bull trend becomes especially strong late, the strength is more likely climactic than the start of an even stronger leg up. Hence, it is more likely an exhaustion gap that a measuring gap.
There is a gap between this month’s low and the breakout point above the August 2016 high. Therefore, the Emini will probably trade below that high with a year or two. Furthermore, the 2014 – 2015 trading range is probably the final bull flag in the 7 year bull trend. Consequently, the Emini will probably trade down to the 1800 bottom of that range within a few years.
Weekly S&P500 Emini futures candlestick chart:
Exceptional buy climax
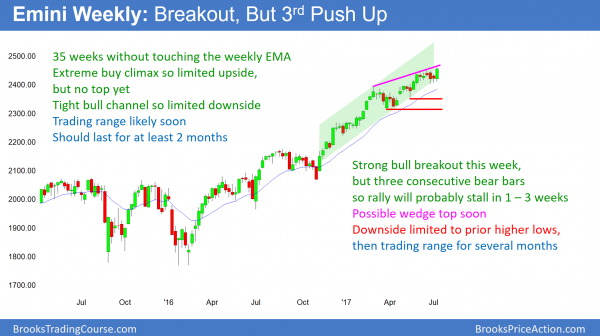
The weekly S&P500 Emini futures candlestick chart had a big bull trend bar this week. However, it followed 3 strong bear bars in a 6 week tight trading range. In addition, it has not touched its 20 week exponential moving average in 35 weeks. Because that is an unusually long buy climax, any rally from here will probably not last long.
The weekly S&P500 Emini futures candlestick chart has not touched its 20 week exponential moving average in 35 weeks. Therefore, this is the most exceptional buy climax in the 18 year history of the Emini. Hence, the rally is unlikely to continue without 1st pulling back to below the average price.
How many more weeks can the rally last? There is no theoretical limit. Yet, there is a practical one. Whenever a market deviates far from its normal behavior, it usually regresses back to the mean. This means that it usually soon begins to behave like it has done in the past. Consequently, betting that this rally will last much longer is a low probability bet.
As a result, all of the traders who have bought over the past 5 – 10 weeks know that they bought at a time when there is an increased risk of a deep pullback. Hence, if the Emini begins to pull back, these bulls will quickly sell out of their longs. The result can be a quick reversal down.
Minor reversal
The weekly chart is in a strong bull trend. Therefore, the selloff will probably be minor. This means that it will more likely lead to a trading range than a bear trend. An obvious target for the bears is the April triangle. That means a 100 – 150 point pullback.
Since the selloff will probably simply be a leg in a trading range, it will probably last 2 – 3 months. The bulls will then probably buy again. However, after a 10 bar selloff, the bears will look to sell a rally back up to around the prior high, hoping for a major trend reversal.
Daily S&P500 Emini futures candlestick chart:
Trump’s healthcare and tax reform not obstacles to new high
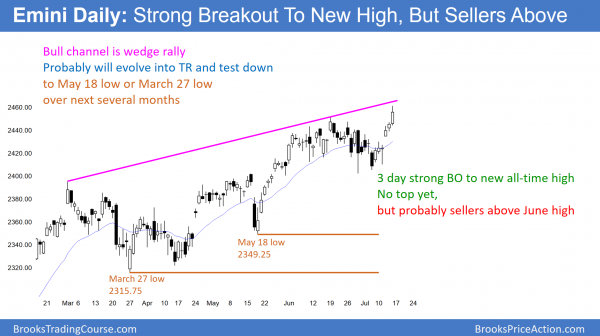
The daily S&P500 Emini futures candlestick chart broke strongly above a 3 week bull channel this week. It also broke to a new all-time high.
The daily S&P500 Emini futures candlestick chart gapped above a 3 week bear channel this week. In addition, the follow-through buying has been good enough to make at least a small 2nd leg up likely. As a result, the bulls will probably buy the 1st reversal down. For example, if the Emini sells off for a couple of days next week into Wednesday’s gap, the bulls will probably buy the selloff.
The bears will see any reversal down from around the June all-time high as a major trend reversal. However, the 3 day bull breakout was strong and the context is good for the bulls. Consequently, most bears will want at least a micro double top and a strong sell signal bar before they will be willing to sell for a swing trade.
5 month bull leg in trading range
The daily chart has rallied in a bull channel from the March low. This rally follows a pullback from a very strong rally in February. This is a Spike and Channel bull trend. February is the spike, or breakout. The rally from the March low is the channel.
From the Market Cycle, traders know that a breakout leads to a channel, which is a weaker trend. The channel has a bear breakout 75% of the time. It then evolves into a big trading range. The bottom of the range is usually around the bottom of the channel. This is the March low around 2320.
Furthermore, the selloff to that low is a bear leg in a trading range. Once a market is near a likely bottom of its range, bears take profits and bulls buy again. Both are buying low and selling high. As a result, the market usually rallies from the bottom of the trading range. This is usually around the bottom of the bull channel.
Trading ranges contain reasonable buy and sell signals
Once a channel evolves into a trading range, both the bulls and bears have setups for swing trades. The bulls and bears are balanced, and each has logical reasons to take swing trades. The bulls usually have a double bottom or triangle bull flag.
The bears, however, usually have a major trend reversal top. This is very different from the current attempt at a top, which would be minor. A top in a tight bull channel usually leads to a trading range. It is therefore minor. A top in a trading range can be major, and lead to an opposite trend, and not just a pullback. If the Emini goes sideways to down for a couple of months, it will form a trading range. The bears will therefore look to sell a rally up to around the old high, hoping for a major trend reversal.
Traders can see the end of the day bar-by-bar price action report by signing up for free at BrooksPriceAction.com. I talk about the detailed Emini price action real-time throughout the day in the BrooksPriceAction.com trading room. We offer a 2 day free trial.
When I mention time, it is USA Pacific Standard Time (the Emini day session opens at 6:30 am PST, and closes at 1:15 pm PST). You can read background information on the intraday market reports on the Intraday Market Update page.


Al, I am looking forward to your options course, I hope you are still planning to do it. Sorry to trouble you but as an options newbie I use simple strategies such as long calls or long puts. My question is managing the trade that is losing, do you risk all of the premium, set a stop at 50 percent of the premium, or set a price action stop based on the chart of the underlying.Any replies greatly appreciated. Thanks.
Yes, I still plan to do the options course, but I am still working on the other course.
My general rule is to exit when down 50%, and to take at least half off when up 100%. However, whenever the premise is no longer valid, I get out before these objectives.
Al, thank you. Best wishes.
All my measured moves arrive at where the market is currently or near
I have 2485
As anyone would know the fuel for this rally is based on cheap money, the market is shaking off all negaitve macro events.
All acts of terrorism, wars, N Korea antics, neg news for Trump etc. but if Yellen becomes hawkish on int rates that will be the tipping point in my opinion.
There has been not been one short chart signal since Dec 2016 and still there is not one showing.
All one can do is keep in mind this fundamental picture in the back ground and wait for the charts to align.
As for fundamentals, everyone knows that rates are going up for years to come. I am totally ignoring the fundamentals when trading. Everyone knows that the Fed will increasingly add a bearish force to the market, and at some point, the market will no longer be able to withstand it. I think it is a mistake to try to reconcile the speed and amount of the rise with what the market is doing.
I believe that the market is trading technically now, as it does 90% of the time. It is searching for a higher price where the shorts will no longer cover and the bulls will no longer buy. We don’t yet know that price. By the time it is clear, the market will already be down 5 – 10%. There are many measured move targets, and 2485 is the next one. There are others above that as well. It is impossible to know which resistance will be the one where the bulls give up.
As you know, I think that the daily chart looks like a bull leg in a trading range, the weekly chart is historically overbought, and the monthly chart had a High 1 bull flag in April after a 4 month buy climax and at a measured move target. To me, all 3 higher time frames look like they will lead to a 3 month pullback and maybe at least a 4 – 6 month trading range. However, while I believe the top will be soon in terms of price and time, there is no top yet.
AI
After watching your trading room video, I have the impression that the majority of your trades would hit the target in a bar or 2 since you only take the high probability trades, thus you do not scale in often, and when you do scale in, the entry of the second portion would be only 1 or 2 points away from the first portion, and again you would mostly exit the entire position in a bar or 2, is that the case?
Thanks!
I think that what you are saying is accurate about my scalps. By definition, if a trader takes 10 or more trades a day, most are scalps, and maybe 1 or 2 are swing trades.
I prefer not to scale in, but I often need to do it to make the math work out. Also, when I am scalping, I usually get out within 1 – 3 bars. However, when the market is very quiet, I sometimes have to hold for 10 or more bars to make a 1 point scalp.