Monthly S&P500 Emini futures candlestick chart:
Trump, Russia, Comey, Mueller and a Emini buy climax
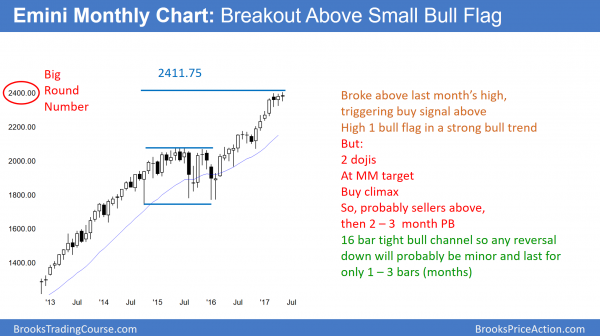
The monthly S&P500 Emini futures candlestick chart has a doji bar so far this month. Last month was a High 1 buy signal bar, and May triggered the buy by going above the April high.
The monthly S&P500 Emini futures candlestick chart is in a strong bull trend. In addition, the rally from November was exceptionally strong. Yet, when a bull trend becomes extremely strong late in the trend, that strength is more likely to lead to exhaustion than a new swing up.
Furthermore, the 2014 – 2015 bull flag has a measured move up to around 2400. Hence, the monthly chart is at that resistance. When there is a High 1 bull flag after a buy climax and at resistance, the upside is usually small.
Typically, the bull breakout lasts for 1 or 2 bars, and then the Emini pulls back for at least a few bars. Hence, the May breakout above the April high might be the end of the rally. In addition, traders will look for a 3 month pullback after this May breakout, or after 1 more month up.
Since there is a measured move target on the cash index, based on that 2 year range, that is around 2500, the Emini might rally further before pulling back. Yet, the weekly chart is so overbought that a pullback over the next couple of months is more likely.
Weekly S&P500 Emini futures candlestick chart:
Buy climax at resistance
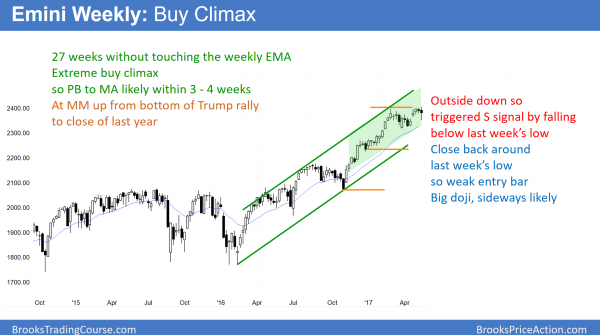
The weekly S&P500 Emini futures candlestick chart has not touched the 20 week EMA for 27 weeks. This is a strong bull trend, but climactic. By trading below last week’s low, the bears triggered a sell signal for the failed breakout above the March high. Yet, this week closed far above its low. It is therefore a weak entry bar.
The weekly S&P500 Emini futures candlestick chart has been in a bull trend for 8 years. If the low of next week stays above the weekly moving average, it will be the 28th consecutive week completely above the average. That has not happened in the 8 year bull trend. The only time it happened in the 18 year history of the Emini was in 2003. But, even then, the weekly chart pulled back very close to its average at 17 and again 25 weeks. Consequently, this current stretch is the most extreme example in the history of the Emini.
While it could continue indefinitely, the Emini is more likely to behave as it has in the past. Therefore, a regression to its mean behavior is more likely. Consequently, the Emini will probably touch its weekly moving average within the next few weeks. Since that average is around 2330, the Emini will probably fall at least 50 points from its current level within a few weeks.
It probably will fall below the average to the around the March low at the bottom of the 2 month trading range. That is around 2300, and the pullback would therefore be about 100 points.
Head and Shoulders top?
If the Emini falls to the bottom of the March trading range, it will probably bounce. Bears will sell a reversal down from a lower high. That would create a head and shoulders top. Topping patterns are usually in trading ranges. Since most trading range breakouts fail, most good looking reversals fail to lead to opposite trends. Many traders still take the short because the reward is much bigger than the risk. Hence, the great risk/reward offsets the 40% probability of a swing down.
Some traders prefer higher probability. They therefore wait for a strong bear breakout and then sell. While the stop is further away, creating more risk, the high probability offsets the reduced risk/reward.
Outside down week
This week traded above the high of the prior week and then below its low. Hence, this week was an outside down week. Because its range was big and it closed in its middle third, next week will probably stay within this week’s range. It would therefore be an inside week. This would therefore create an ioi Breakout Mode pattern.
If next week is a bull bar, traders will be more willing to buy above its high, despite the buy climax. Furthermore, if the following week trades below that bull bar, there will probably be more buyers than sellers below.
In contrast, if next week is a bear inside bar, traders will see it as a weak buy signal bar, and many will sell above its high. In addition, they will see it as a good sell signal bar and sell below its low.
Daily S&P500 Emini futures candlestick chart:
Strong reversal up from sharp selloff
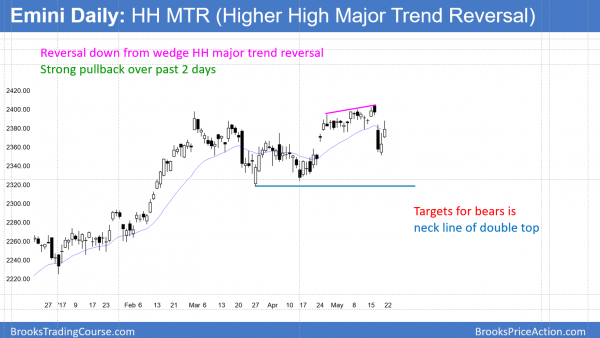
The daily S&P500 Emini futures candlestick chart sold off strongly on Wednesday, but reversed up strongly on Thursday and Friday.
The daily S&P500 Emini futures candlestick chart reversed down from a wedge higher high major trend reversal this week. Yet, the bulls bought the selloff. The bears created a gap down on Wednesday, resulting in both a 2 day and month-long island top.
Friday’s strong reversal up could lead to a gap up on Monday. If so, that would create a 3 day island bottom. Since the Emini has been in a trading range for 2 months, island tops and bottoms are not strong predictors of the future direction. Yet, they still are a sign of strength. Traders need follow-through before they believe that the gap is the start of a trend. Without it, the trading range is likely to continue.
This week’s Big Down, Big Up created Big Confusion. Therefore, the Emini will probably go sideways next week.
This week’s reversal up is similar to that of September 12, 2016. That rally retraced almost to the top of the selloff. Yet, the Emini reversed down from a lower high, and traded sideways to down for the next 2 months.
Buy puts or put spreads on rallies
While there is a 30% chance of a relentless rally to 2500, the weekly buy climax will probably control the market. Since a pullback to the weekly moving average is likely over the next few weeks, this rally on the daily chart will probably fail. This is true even if it makes a new high. Rallies therefore offer good opportunities for traders to buy puts or put spreads.
The selloff of September 2016 was mostly sideways. If the current selloff is similar, it will be difficult for put buyers to make much money if they buy and hold. When a market is in a tight trading range, even if it is sloped down, expert traders make more money by buying low, selling high, using limited entry orders, and scalping.
Traders can see the end of the day bar-by-bar price action report by signing up for free at BrooksPriceAction.com. I talk about the detailed Emini price action real-time throughout the day in the BrooksPriceAction.com trading room. We offer a 2 day free trial.
When I mention time, it is USA Pacific Standard Time (the Emini day session opens at 6:30 am PST, and closes at 1:15 pm PST). You can read background information on the intraday market reports on the Intraday Market Update page.


Al,
I think that you was right when you had said ealier that correction of about 150 points is expected. And the level of 2260 -2250 (EMA 50) is likely to be achieved within the next 3-5 weeks. Because the 2nd push down of a correction was 130-140 points and lasted 3-6 weeks after bull leg after trading range 2014-16 on weekly chart . And maybe even drop on 180 points to a 50% correction of the 3rd bull leg on weekly chart. It is a mechanical counting but what do you think?
Because the bulls are holding up well, I think the odds are that the 1st push down will end just below the weekly EMA at around 2300, which is the bottom of the 2 month range. I then think it will bounce. The bears would want a lower high. It does not matter if there is a new high because I think the upside, even after testing below the weekly EMA is probably limited to around 2500. At some point at 2500 or below, the odds favor a move down to the 1800 bottom of the 2014-2015 trading range. It will probably be the final bull flag before that correction.
Thank you, Al.
Thanks, Al. Your weekly analysis is very, very helpful as I’m climbing the learning curve here. Things are starting to come into focus for me and I’m getting really stoked. Keep up the great work – it’s very, very appreciated!
Brad
Hi Al,
Because the ES broke out of a BR W on the Daily Chart this wednesday, we should expect TBTL sideways to down correct?
I think the dominant thing is the weekly buy climax. It will be hard for the bulls to get much of a rally without first pulling back to the weekly EMA. If they were to get a strong breakout, the odds of a strong reversal down and bigger selloff would go up. Now, I expect a pullback to the bottom of the 2 month range, whether or not there is a minor new high first.