Monthly S&P500 Emini futures candlestick chart:
Buy climax
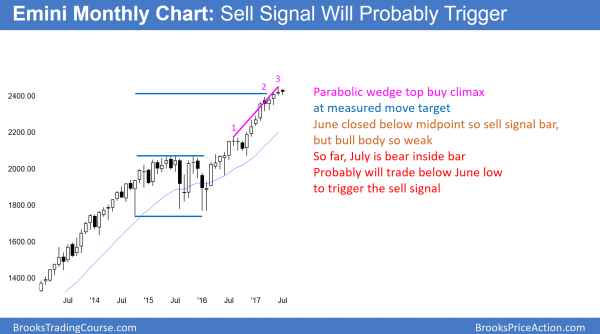
The monthly S&P500 Emini futures candlestick chart is in a strong bull trend. However, it has a parabolic wedge rally. Last month is the sell signal bar.
The monthly S&P500 Emini futures candlestick chart is in a strong bull trend, but it is climactic. The parabolic wedge top will trigger if July trades below the June low. Since the Emini is at a measured move up from the 2014 – 2015 trading range, it is as important resistance. It is therefore likely that July will trade below June at some point.
Also, April was a High 1 buy signal bar. Since it followed a 4 bar buy climax and it is at resistance, the bull breakout usually lasts a few months. The Emini then typically pulls back for a few months. Therefore, the odds are that it will pull back within the next month or two.
Minor reversal only
Since the 17 month bull trend is in a tight bull channel, the downside risk over the next few months is small. Any reversal would therefore probably be minor. This means that it will become either a bull flag or a bear leg in a small trading range. Probably the best the bears can get is a small pullback to around the April low. Yet, that is 100 – 150 points down. It would therefore be a bear trend on the daily chart.
There is a 40% chance that a pullback from a parabolic wedge top becomes endless. This means that it could last 10 or more bars in a tight bear channel. If that happens, then the bears would have a 40% chance of a bear break below that bull flag, and then a measured move down.
Weekly S&P500 Emini futures candlestick chart:
Trump, Putin, North Korea are less important than buy climax
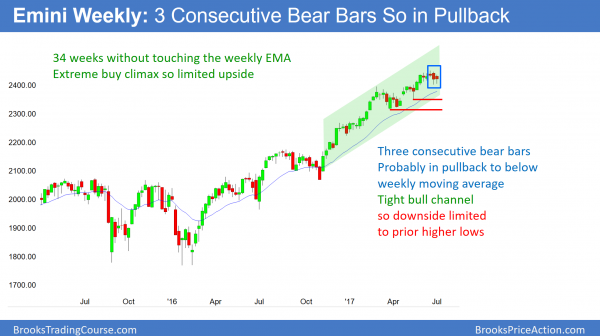
The weekly S&P500 Emini futures candlestick chart has had 3 consecutive bear bars. It is probably pulling back to the weekly moving average.
The weekly S&P500 Emini futures candlestick chart is the most overbought in its 18 year history. It has never been this far above the 20 week exponential moving average for this many bars before. Hence, this is unsustainable and climactic. The odds are that it has begun a pullback to below the moving average. When it pulls back to the moving average, it usually falls at least 20 – 40 points below. That would be around the 2350 area, and hence at least a 100 point pullback.
While it is possible that the Emini makes one more new high before testing the moving average, this is unlikely after 3 bear bars.
Daily S&P500 Emini futures candlestick chart:
Increasing selling pressure
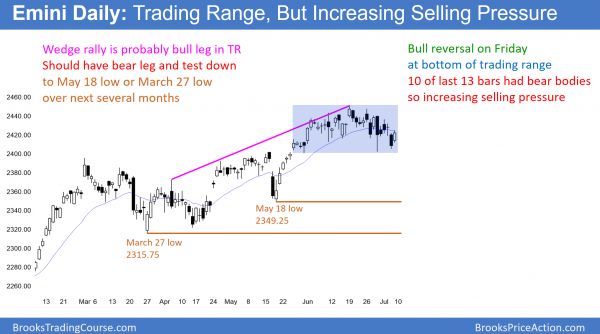
The daily S&P500 Emini futures candlestick chart reversed up on Friday, but there were 10 bear bars in the past 13 days. While still in a trading range, this increasing selling pressure makes a bear breakout more likely.
The daily S&P500 Emini futures candlestick chart has been in a trading range for a month. However, it has had 3 pushes up from the March – April trading range. This therefore has been a wedge rally. A wedge rally after a final flag is usually a bull leg in what will become a trading range. Hence, it usually leads to a bear leg in the developing range. Furthermore, that March- April trading range is a likely final bull flag. Consequently, the Emini will probably begin to pull back into that bull flag.
A logical target for the bears is a test of prior major lows. The first one is the May 18 low at 2349.25. If the Emini breaks below that, the next target is the bottom of the trading range in the 2300 – 2320 area.
If the Emini falls to that area, it will probably go sideways for a month or two. This is because it is support, and the weekly and monthly charts are so strongly bullish. The odds are that bulls will buy a 2 – 3 month selloff to that support level. Hence, the selloff will probably lead to at least one more attempt at a new high.
Traders can see the end of the day bar-by-bar price action report by signing up for free at BrooksPriceAction.com. I talk about the detailed Emini price action real-time throughout the day in the BrooksPriceAction.com trading room. We offer a 2 day free trial.
When I mention time, it is USA Pacific Standard Time (the Emini day session opens at 6:30 am PST, and closes at 1:15 pm PST). You can read background information on the intraday market reports on the Intraday Market Update page.


Dear Al,
I still have a hard time accepting the fact that this market is supposed to be all technical and not influenced by political events. How would traders feel and act if North Korea were to launch a couple of ICBMs at Japan, or God forbid the US? I suspect the majority of investors would get the hell out of risky assets and wait for clarity.
Clearly, I agree with you that news affects the markets. This question comes up occasionally, and I will answer it again here.
Look at the stock market after 911 or Pearl Harbor, or the oil market after Reagan bombed Gaddafi, or Alibaba after last month’s great earnings report. Furthermore, fundamentals govern all markets over the long-term. However, they move in a band, even on the monthly charts. Moreover, that band can be very broad; most of that movement is technical. Every market is constantly probing to find the borders of the band. Consequently, 99% of what happens is technical.
Also, most reversals come after news, even if the news is minor. You sometimes hear me talk about “give up bars” at the start of a reversal. They usually come on some minor news. Yet, they also occur at major support or resistance, and that support or resistance is much more important than the news. How do I know? Because if the new trend lasts for months, there are usually many additional, more important, opposite news items that do not reverse the new trend back to the old direction.
Finally, anyone trading on news, except during a very strong breakout, will lose money. The institutions are infinitely better at getting ALL of the news, and getting it faster, and analyzing it more accurately than you and I are. CNN only reports the big story. There are always countless other variables that only an expert in the field sees or understands. We cannot compete on that battlefield. In addition, the news is almost always either priced in before it happens because it was anticipated, or immediately after if it was a surprise. Look at Alibaba. It broke strongly up a month ago on great news, but has been sideways since. If you bought because of that great news, you probably have not made money, or you might have given up and taken a loss.
While we cannot compete in news analysis, we can see where the money is going by simply looking at the charts. The institutions cannot hide their analysis. They share it with us constantly. The charts are the footprints of where they are putting their money. Therefore, most profitable traders rely mainly on technical factors, like support, resistance, and momentum. However, many pundits on TV like to give a fundamental reason for their trade in addition to their technical reason. When one does, I always assume he is a fool, and that he is trading purely technically.
Thank you for your detailed reply. I appreciate your insight!