Yellen Fed interest rate hike announcement
Updated 7:11 a.m.
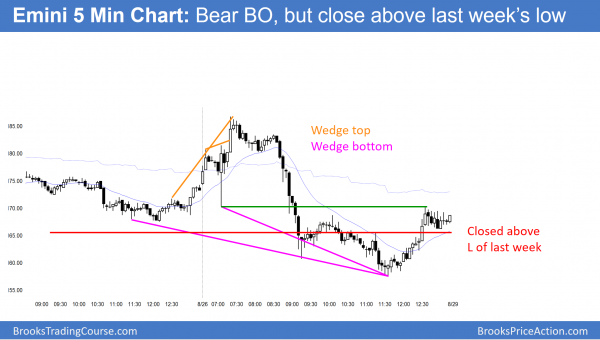
The Emini broke above the 3 day tight bear channel on the open. It sold off sharply on Yellen’s remarks, and then reversed up to a new high of the day. This Big Up, Big Down, Big Up trading creates confusion. It therefore increases the chances of a lot of trading range price action today.
While the Emini is Always In Long, the bulls need follow-through buying before traders believe that this bull reversal is the start of a bull trend day. Yet, the reversal was strong enough and the context good enough so that today could become a big Spike and Channel Bull Trend Day.
The odds of a bear trend day after this reversal up are now much less.
Pre-Open Market Analysis
The Emini yesterday reversed up from 1 tick below the open of the month. The open of the month is important in August. There have been 6 consecutive bull bars on the monthly chart, which is unusual. Hence, this pattern is unsustainable and climactic. The odds are that August will have a bear body when it closes on Wednesday. Therefore, Wednesday’s close will probably be below the August 1 open.
The bulls want another bull trend bar. They correctly believe it would be a sign of strength. Yet, it would be extreme strength. If August closes with a bull body, September would have about an 80% chance of having a bear body. The month does not have to be a big bear trend bar. It simply needs any bear body, even a single tick tall, to accomplish the bear goal.
Yellen and the Fed
Yellen speaks today. Traders want to know if she will talk about the timing of the interest rate hike. Because the Emini has been in a tight trading range for 2 months, it is neutral. It is therefore on breakout mode.
Whether she says that the Fed will raise rates in September, December, or 2017 is irrelevant. No one knows how much is already priced into the market. Traders should assume that the market is neutral. Hence, the probability of a bear breakout is as likely as it is for a bull breakout. Furthermore, the breakout up or down has a 50% chance of reversing.
Most noteworthy is that the market can rally on bad news or selloff on good news. Ignore the experts on TV and trade what is in front of you. IF the Emini rallies strongly, buy. If it sells off strongly, sell.
What about the news? I don’t care and I will not pay any attention. Price is truth. The only way we will know if more institutions are buying or selling is to look at the charts. The institutions cannot hide what they are doing. We simply trade in the direction of the move, and ignore what the experts on TV say is certainly going to happen.
Friday’s close
Today is the last day of the week. Therefore weekly support and resistance can be important, especially in the last hour. The bears want the week to close below last week’s low. That would create an outside down bar on the weekly chart. Traders would therefore see it as a sign of strong bears. Hence, it would increase the odds that a 50 – 100 point pullback has begun.
The bulls want a bull body on the weekly chart. There are still targets above and until the bears clearly take control, the bulls will keep buying. They will try to prevent the week from going outside down.
Emini Globex session
The Emini did not react to the GDP. It has been in a 4 point range overnight. While it formed a Lower Low Major Trend Reversal (basically, a Double Bottom) on the 5 minute chart yesterday after 3 days of selling in a tight channel, the bears still have a 40% chance of a swing down on the daily chart. Because the 3 day bear channel is so tight, the odds favor a bull breakout and at least 2 legs sideways to up today.
Yet, there is a 40% chance that the bears have taken control. If so, they will begin to leave signs, like a close below last week’s low, or a bear bar on the monthly chart. If the bears are in control, they will probably soon create a big bear trend bar on the daily chart. The bar will probably close below the August and maybe even the July low.
Forex: Best trading strategies
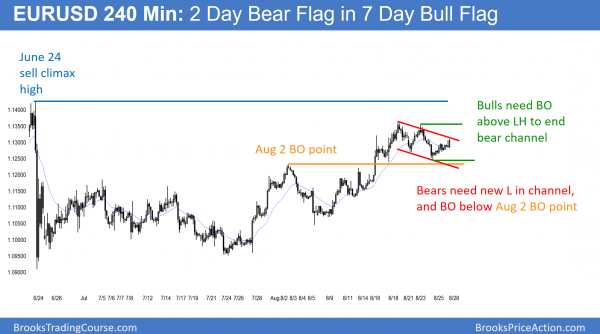
The 2 day rally on the 240 minute chart is a bull leg in a bear channel. Hence it is a bear flag. However, it is within a 7 day bull flag. The bears need to keep getting lower highs. If the bulls break above the August 23 lower high, the bear channel will end. The chart would then either be in a trading range or a bull trend. The bulls still want a test of the June 24 sell climax high.
When both the bulls and bears have valid arguments, they are balanced and the chart is in a trading range. It is in breakout mode. The target after the breakout would be a measured move based on the approximately 100 pip height of the range.
The EURUSD daily Forex chart has been sideways for 7 days. With a possible Yellen Fed interest rate hike announcement today, all financial markets might breakout. Yet, the direction can be up or down, no matter what she says. Forex day traders should simply wait for the breakout.
When the market is in breakout mode like this, there is a 50% chance that the initial breakout will fail. Furthermore, there is a 50% chance that the breakout will be up, and 50% chance it will be down. While the EURUSD chart remains in a 30 – 50 pip range, traders will mostly scalp. Yet, they will quickly switch to swing trading if there is a strong breakout up or down.
Yesterday bounced up from the bottom of a 6 day trading range. The rally continued overnight. While the 2 day bull channel on the 240 minute chart is tight, it lacks consecutive big bull trend bars. Because it is in a 4 day bear channel, it is a bear flag. Yet, when a bear flag is in a tight channel like this, especially when that channel is in a bull flag on the daily chart, there is almost a 50% chance of a bull breakout above the bear flag.
The EURUSD Forex chart did not react to the GDP report this morning. It has been in a 30 pip range overnight. Hence, day traders are scalping. The rally is now around a 50% pullback from the last leg down. This is the sell zone. Since the chart is in breakout mode, traders have to be ready to buy a strong bull breakout.
The bears need to get above the August 23 lower high to end the bear channel. That would convert the bear trend into either a trading range or a bull trend. The bulls want a break below Wednesday’s low. That would be a breakout below the 7 day trading range, and the bears would then look for a test below the August 2 breakout point.
Summary of today’s S&P Emini futures price action and what to expect tomorrow
The Emini reversed up after Yellen started speaking, and then sold off strongly to below last week’s low. Yet, it rallied to close above last week’s low.
The Emini is deciding whether the 50 – 100 point correction has begun, or if there will be one more new high to the 2200 resistance first. The bears need follow-through selling next week.
The month closes on Wednesday. The bears want a close below the open. Hence, this would create a bear bar on the monthly chart.
See the weekly update for a discussion of the price action on the weekly candlestick chart and for what to expect going into next week.
Traders can see the end of the day bar-by-bar price action report by signing up for free at BrooksPriceAction.com. I talk about the detailed S&P Emini futures price action real-time throughout the day in the BrooksPriceAction.com trading room. We offer a 2 day free trial.
When I mention time, it is USA Pacific Standard Time (the Emini day session opens at 6:30 am PST, and closes at 1:15 pm PST). You can read background information on the intraday market reports on the Intraday Market Update page.


