Emini buy climax awaiting Trump’s tax reform after FOMC
Updated 6:52 a.m.
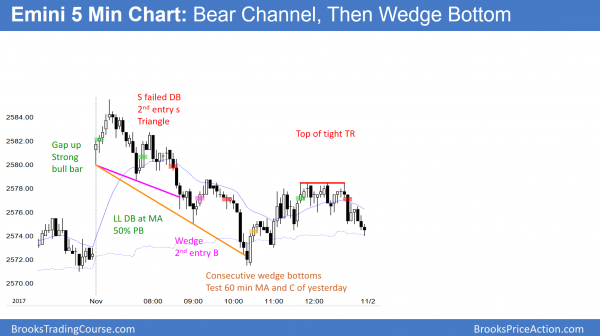
Today opened at yesterday’s close in the middle of yesterday’s 4 hour range. The bears want a strong break below yesterday’s low to trigger a sell signal on the daily chart. The bulls want a major trend reversal up. However, the early tight trading range increases the odds of the Emini being mostly sideways for the 1st 2 hours. Furthermore, it increases the chance of another trading range day. Since the Emini might reverse up from above yesterday’s low, it could be an inside day.
Yesterday is a sell signal bar for a wedge top on the daily chart. The odds still favor a test below yesterday’s low in the 1st 2 hours. Traders want to see if there are more buyers or sellers there. Yet, yesterday had a prominent tail and the daily bull trend is strong. This therefore reduces the chance of a big bear trend day.
Pre-Open market analysis
While yesterday was a bear day on the daily chart, it had a prominent tail on the bottom of the bar. It is a sell signal bar for a 3 week wedge top. However, the bull trend is strong. Therefore, the odds are that the reversal down will be minor, like all of the other topping attempts over the past 6 months. Most tops fail and lead to higher prices. That is what is likely to happen again. But, since the daily, weekly, and monthly charts have never all been this overbought, the odds favor a 5% correction beginning this year. However, until there is a strong reversal down with follow-through selling, the odds continue to favor at least slightly higher prices.
I mentioned that the Emini November 5th close is usually above the October 26 close. That bull window ends soon. In addition, there is an adage on Wall St. about the holidays: “Thanksgiving is owned by the bears and Christmas is owned by the bulls.” That means that there is often a selloff in the middle of November. I have not tested this to know if it is true, but I always enjoy watching seasonal tendencies unfold. I want to emphasize that I totally ignore them when I make trading decisions. This is because I cannot convince myself that I make more money by considering them.
Overnight Emini Globex trading
While the Emini is up 1 point on the Globex chart, it is at the top of a reversal from a 12 point overnight selloff. The day session will therefore probably open within yesterday’s 4 hour range. The bulls will try for a higher low major trend reversal. Yet, the bear want a resumption of yesterday’s bear trend. Since the 5 minute day session chart will probably open within its 4 hours range, the open will then be neutral.
Yesterday’s setups
Here are several reasonable stop entry setups from yesterday. I sometimes also show limit order entries and entries on the close of bars.
EURUSD Forex market trading strategies
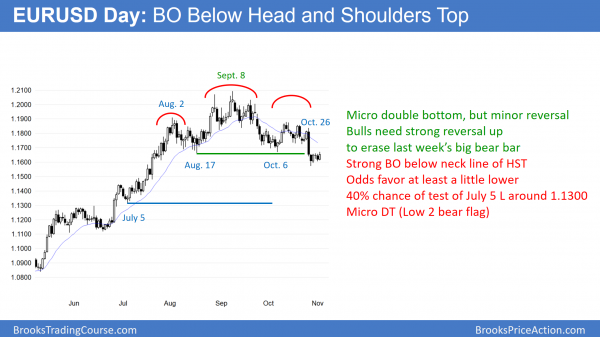
The EURUSD daily Forex chart is in a 5 day tight trading range after last week’s break below a 4 month trading range. The bulls have a micro double bottom, and a big High 2 bull flag with the October 6 low. Today’s rally creates a potential micro double top bear flag. Since last week’s selloff was very strong, the odds favor at least slightly lower prices over the next couple of weeks.
As I have been saying, the daily chart is forming a tight trading range with both a small reversal pattern and a small bear flag. Since last week’s selloff was unusually strong, the odds favor at least slightly lower prices over the next couple of weeks. However, when a big breakout immediately stalls just below the breakout point, the odds of a measured move down are less. Furthermore, the weekly chart has pulled back to its 20 week exponential moving average in a strong bull trend. This will likely limit the extent of the selling.
Since the bear channel on the weekly chart is tight, the first reversal up will probably be minor. This means that the best the bulls will probably get over the next few weeks is a tight trading range on the weekly chart. That would be a trading range on the daily chart, which now has to discover the top and bottom of that range. Consequently, the bear breakout has been strong and the odds favor at least a little more selling over the next couple of weeks. But, the odds are against a sustained move up or down.
Strong bull trend on the weekly chart
The weekly chart has not touched the 20 week exponential moving average in more than 20 weeks. Therefore, last week’s pullback to the moving average will attract buyers. They have been so eager to buy that they have been buying above the average price for months. They are happy to finally get to buy at the average price. Last week was a big bear bar on the weekly chart. The bears need another bear bar this week to increase their chances of a measured move down below the 4 month range. Yet, this week so far is a bull. That is disappointing follow-through for the bears. It therefore makes the 2 month selloff more likely just a bear leg in a bull flag and not the start of a bear trend.
The 9 week selloff is in a tight bear channel. Hence, the chart will probably have to go mostly sideways for several weeks before the bulls will be able to get a test back up to the September high. Furthermore, last week’s bear bar was big enough so that the bears might get 1 or 2 more brief legs down. However, the odds still favor a continuation of the 4 month range rather than a reversal into a bear trend.
Overnight EURUSD Forex trading
The 5 minute EURUSD Forex chart has been in a tight trading range for 5 days. Day traders have therefore been scalping. There is no sign of a breakout. In addition, the 1st breakout of a tight range usually does not get very far. As a result, unless there is a strong breakout up or down, day traders will continue to scalp today.
Summary of today’s S&P Emini futures price action and what to expect tomorrow
I am speaking in Las Vegas tomorrow and had to leave early today. Therefore, I did not post a chart today.
I left early today to go to Las Vegas to speak tomorrow. Today sold off strongly on the open and then abruptly reversed up. By falling below yesterday’s low, the Emini triggered a sell signal on the daily chart. Yet, it reversed up after an early collapse and traded back above yesterday’s low.
The sell signal is still in effect until the Emini rallies above yesterday’s high. However, most trend reversal attempts fail. Therefore, any reversal down will probably be minor. Since the buy climaxes on the daily, weekly, and monthly charts are extreme, the odds favor a 5% correction. Yet, the bulls will continue to buy every reversal down until the bears get consecutive big bear bars on the daily chart.
See the weekly update for a discussion of the price action on the weekly candlestick chart and for what to expect going into next week.
Traders can see the end of the day bar-by-bar price action report by signing up for free at BrooksPriceAction.com. I talk about the detailed S&P Emini futures price action real-time throughout the day in the BrooksPriceAction.com trading room. We offer a 2 day free trial.
When I mention time, it is USA Pacific Standard Time (the Emini day session opens at 6:30 am PST, and closes at 1:15 pm PST). You can read background information on the intraday market reports on the Intraday Market Update page.


