Stock market pullback into Fed interest rate hike
Updated 6:47 a.m.
The Emini broke strongly to a new all-time high on the open. On the 60 minute chart, it has been above the moving average for 43 bars, which is a long time. It will probably get there by the end of tomorrow, before or after the report.
While the Emini is clearly Always In Long, and there are measured move targets around 2270, this is climactic behavior late in a bull trend. Therefore the odds of a big rally from here are small. More likely, the Emini will either enter a tight trading range or an endless pullback for the next several hours. Yet, if the breakout converts into a tight bull channel, traders will buy as long as the channel continues. This is more likely an exhaustive end of a trend than the start of a new leg up.
Pre-Open Market Analysis
Yesterday reversed down from a small parabolic wedge on the open. The 60 minute chart has not touched the moving average in about 50 bars. Because that is unusual, it is unsustainable. It is therefore a buy climax. Most climaxes lead to trading ranges and not reversals.
Yesterday began to pull back after a buy climax. Tomorrow’s report has risk. As a result, the odds are that the 60 minute chart will reach its average price today. Furthermore, the bulls will probably be unable to create a strong rally after a buy climax going into the FOMC rate hike. Therefore, today will probably be sideways to down, and mostly a trading range day.
While a trend day can come at any time, a strong bull trend day is unlikely after a buy climax on the daily chart. If there is a strong trend day today, it will probably be down. Yet, the 1st reversal down after a buy climax is usually minor. Therefore, the bulls will probably buy the selloff. Because of Wednesday’s major announcement, the bulls will probably wait to buy until after the report.
Overnight Emini Globex trading
The Emini is up 7 points in the Globex market and is therefore testing the day session’s all-time high. Yet, yesterday had a reasonable buy climax, which usually leads to a 2nd leg sideways or down. Because tomorrow is a major catalyst for a big move up or down, this is another force that will tend to limit today’s range.
Yet, the recent daily ranges have been big enough for at least one swing up or down. Therefore, that will probably be the case today as well, despite the likelihood of a lot of trading range price action.
EURUSD Forex Market Trading Strategies
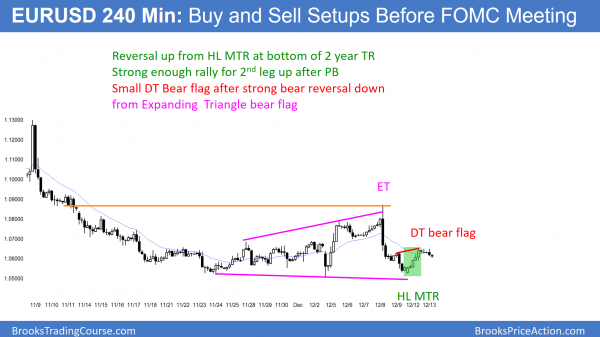
The EURUSD had a strong enough bounce so that at least a small 2nd leg u p is likely today or tomorrow. Yet, the bears have a reasonable double top bear flag. The 240 minute chart is in breakout mode.
While yesterday’s rally covered a lot of pips, it was still small compared to last week’s selloff. The bears will sell here because it is a double top bear flag. Yet, is it just above the bottom of the 2 year trading range. The bulls will therefore buy, betting that the trading range will continue.
Both are reasonable trades. The bulls have better risk reward. Because of the momentum down, the bears have higher probability of at least a little more down. As a result of both sides having reasonable trades, the EURUSD is in breakout mode going into tomorrow’s FOMC report. Day traders will probably only scalp today or tomorrow. A big trend day is unlikely.
Overnight EURUSD Forex trading
The range was small overnight, and it has been less than 30 pips for 7 hours. This makes even profitable scalping difficult. As a result, traders will probably have few trades today. While a strong breakout is always possible, it is not likely.
Summary of today’s S&P Emini futures price action and what to expect tomorrow
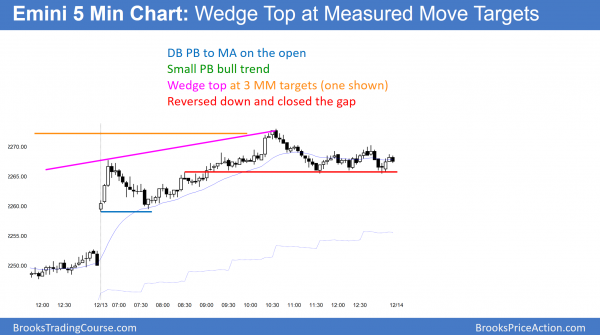
After a buy climax on the open, the bulls rallied from a double bottom at the moving average. While the rally was a small pullback bull trend, it was also a buy vacuum test of several measured move targets at the high of the day. Furthermore, the reversal down was at the top of a channel.
The Emini reversed down today at many targets. Because the 60 minute chart has not touched its 20 bar moving average in 7 days, and that is unusual, the odds are that it will pull back to that average tomorrow. That pullback can come before or after the report. Day traders should not trade in the 10 minutes after the report because the initial move reverses more than 50% of the time.
See the weekly update for a discussion of the price action on the weekly candlestick chart and for what to expect going into next week.
Traders can see the end of the day bar-by-bar price action report by signing up for free at BrooksPriceAction.com. I talk about the detailed S&P Emini futures price action real-time throughout the day in the BrooksPriceAction.com trading room. We offer a 2 day free trial.
When I mention time, it is USA Pacific Standard Time (the Emini day session opens at 6:30 am PST, and closes at 1:15 pm PST). You can read background information on the intraday market reports on the Intraday Market Update page.


Hi Al,
Several years ago you mentioned the possibility of a measured move on the monthly chart from Mar 2009 extending to roughly 2273 with a mid point at a Jan 2013 gap. I marked my chart then and forgot it. Now we are at 2273. If I marked the measured move right, is there a greater significance of a 7 year MM price action versus say a 1 hour MM? Is this a reversal point?
Computers treat them the same. I am always looking at weekly and monthly charts for support and resistance, but because a bar takes a month to form, the targets are important far less often than those on 5 minute charts.
I don’t remember mentioning it. One important point about the Emini is that it rolls over every 3 months so the prices change. If I was talking about the cash chart, the prices do not change.