Stock market January barometer is strong, but 5% correction soon
Updated 6:40 a.m.
Today gapped down to around yesterday’s low, despite yesterday’s strong reversal up into the close. The bulls want a higher low major trend reversal after yesterday’s lower low major trend reversal. Because there was a strong selloff yesterday and then a strong rally, and a big gap down today and an early rally, the Emini is forming a trading range. Every trading range has both a reasonable buy setup and sell setup, and each has about a 40% chance of success.
At the moment, this is a trading range open. Consequently, the Emini might go sideways for an hour or more before deciding on the direction of the 1st swing. The reversals up make an early strong bear trend unlikely. The reversals down make an early bull trend unlikely. However, today will probably have good swings up and down, even if it spends a lot of time going sideways.
Pre-Open market analysis
January was a very big bull bar on the monthly chart, and it was late in a bull trend. It is therefore probably an exhaustion bar. Consequently, the rally will probably pause for at least a month or two. While February can also be another huge bull bar, that is unlikely when the Emini is this climactic.
February is the follow-through bar after the big January breakout. Since the monthly chart has never been this overbought, the odds are that February will be disappointing for the bulls. For example, it might be a doji. If so, February would be mostly sideways. Less likely, it could totally reverse January and pull back below the January low to test last year’s close.
There has not been a pullback on the monthly chart in 15 months. This is therefore a 16 bar bull micro channel. Since the bull trend is so strong, traders will buy below the prior month’s low. Because January was huge, February will probably not trade below January’s low. If it does not, March will probably trade below February.
Possible head and shoulders top on 60 minute chart
If there is a rally over the next few days, the bears will try to create a lower high major trend reversal on the 60 minute chart. They also see the VIX creeping up. Many will begin to take profits on rallies. For example, if there is a 2 – 3 day rally, the bulls might reduce their positions. In addition, the bears will sell, expecting at least a small 2nd leg down after the strong 3 day pullback. The result could be a head and shoulders top on the 60 minute chart.
If that forms, there would be a 40% chance of a measured move down over the next couple of weeks. At the moment, sideways is more likely for a couple of weeks. If the bears get a strong bear breakout, the odds of a 5% correction could quickly become 60%.
Overnight Emini Globex trading
The Emini is down 9 points in the Globex session. If a 5% correction has begun, it could be very fast. This is because everyone who bought over the past month expected a quick profit. They instead will be holding losing positions. Since many are essentially scalping on the daily chart, they will not risk much. Consequently, they will be quick to sell. The result can be a fast 100 – 150% selloff over the next couple of weeks.
The past couple of weeks have had lots of good swings for day traders. This is likely to continue today. Yesterday’s rally was strong enough so that the bulls will probably buy today’s gap down to around yesterday’s low. Yet, if the 5% correction has begun, the selling could be relentless. There is therefore an increased chance of either a strong rally or a strong selloff today.
Yesterday’s setups
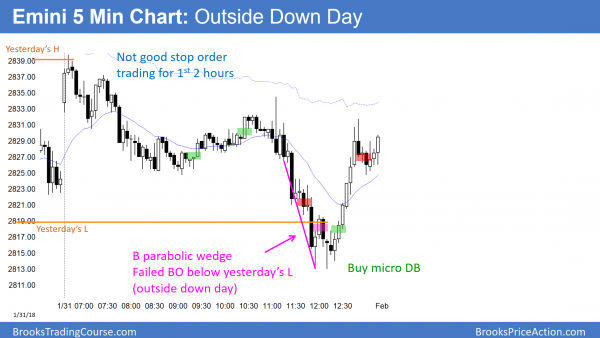
Here are several reasonable stop entry setups from yesterday. I sometimes also show limit order entries and entries on the close of bars.
EURUSD bull flag, but parabolic wedge at resistance
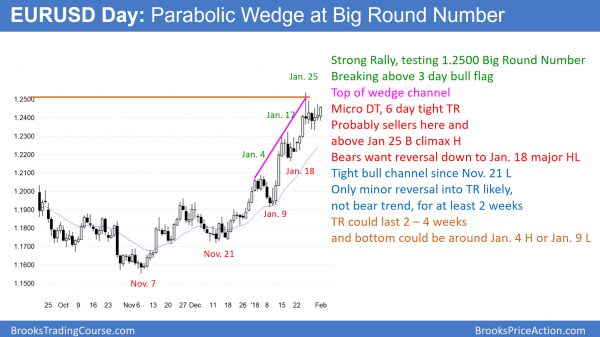
The EURUSD daily Forex chart is in a parabolic wedge buy climax at the 1.2500 Big Round Number. It is breaking above a 3 day bull flag, but the odds are that there will be sellers above.
The EURUSD daily Forex chart is in a strong bull trend. Since the trend is in a tight bull channel with a series of 3 buy climaxes, the channel is a parabolic wedge. This is a buy climax pattern. Furthermore, the chart is at the resistance of the 1.2500 Big Round Number. In addition, the monthly chart has a possible wedge bear flag. Finally, 4 of the past 5 days had prominent tails above and the 5th was a bear day. This is a sign of a loss of momentum and it increases the chances of a transition into a trading range.
The bulls want another leg up in the bull trend. Yet, the above factors make it more likely that the daily chart will begin to transition into a trading range. Consequently, it will likely begin to turn down from the current level or from just above last week’s high.
Since the bull channel is tight, the reversal will probably be minor. This means that it will probably have a couple of legs down to support, like the January 18 major higher low around 1.2150. The trading range could last 2 – 4 weeks before the bulls get another test of last week’s high and 1.2500.
Overnight EURUSD Forex trading
The EURUSD 5 minute Forex chart rallied 75 pips overnight. It is now testing the high of the past 2 days, where it sold off. The rally is strong enough to make a bear trend day unlikely. Yet, because it is now at a resistance area, it will probably not go much higher before pulling back into a trading range
The initial rally was a strong breakout. After a pullback, it is now in a 2nd leg up. This is probably a Spike and Channel bull trend. If so, it will probably have a 3rd push up and form a wedge top. The 2nd top was about 10 pips above the 1st. Therefore, there will probably be sellers 10 – 20 pips above the 2nd top. Then, traders will look for a couple of legs sideways to down. The pullback after the initial breakout fell to around 1.2425. That is a magnet for the possible bottom of the range.
A strong breakout above the 6 day tight trading range or a strong reversal down are less likely.
Summary of today’s S&P Emini futures price action and what to expect tomorrow
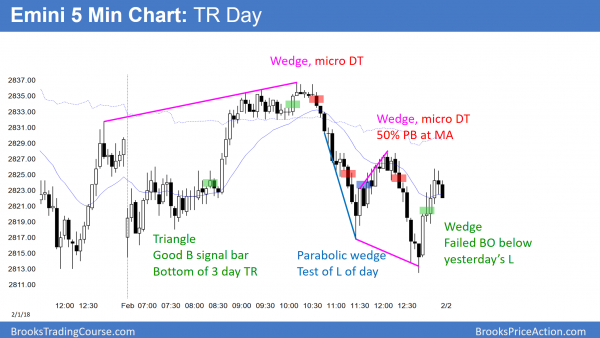
The morning rally reversed down from the 60 minute EMA and the top of the 3 day tight trading range. It then reversed up from the bottom of the 3 day range and formed a trading range day.
Today rallied early, but the bull breakout failed. This was a 2nd leg trap that tested the top of the 3 day range and the 60 minute EMA. It sold off to below yesterday’s low and then reversed up into the close. The Emini is deciding whether the 3 day range is a lower high major trend reversal and head and shoulders top or a bull flag on the 60 minute chart. Tomorrow’s unemployment report could provide the answer. At the moment, it is slightly more likely that there will be a rally that will retrace about half of this week’s selloff, and then a big 2nd leg down.
See the weekly update for a discussion of the price action on the weekly candlestick chart and for what to expect going into next week.
Traders can see the end of the day bar-by-bar price action report by signing up for free at BrooksPriceAction.com. I talk about the detailed S&P Emini futures price action real-time throughout the day in the BrooksPriceAction.com trading room. We offer a 2 day free trial.
When I mention time, it is USA Pacific Standard Time (the Emini day session opens at 6:30 am PST, and closes at 1:15 pm PST). You can read background information on the intraday market reports on the Intraday Market Update page.


