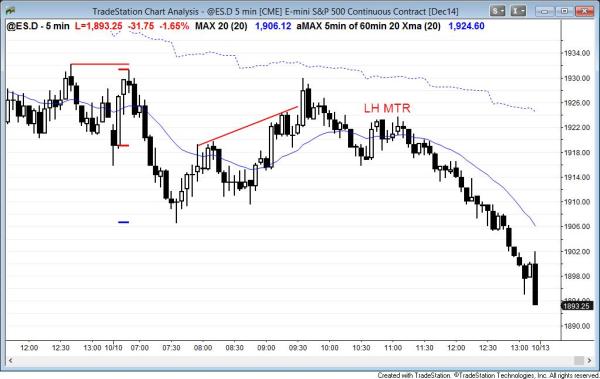
End of day comments about today’s Emini price action and day trading: Strong bear breakout on the daily chart

The Emini reversed up strongly on the open, but failed to get above yesterday’s lower high and then sold off to a new low of the day. It became a big bear trend day, closing below 1900, and it is a strong bear breakout on the daily chart.
In the first hour, the Emini broke below the low of the open and fell for a measured move down. The measured move was from the top of the rally to the open of the first bar of the bull breakout (the second bar of the day). It then reversed up in a 9 bar bull microchannel to back above the opening low, but the rally lacked consecutive strong bull trend bars. This was all trading range price action and it set the tone for day trading until the final two hours. It then melted into a huge parabolic bear trend.
After rallying 27 points, it then sold off to a new low of the day and closed far below 1900 and below the two week long double bottom. Today is the entry bar on the daily chart for the breakout below the double bottom, and this is a strong bear entry bar. Although the Emini might double bottom with the August low, this bear breakout is strong enough so that it will probably have at least two legs down. It might be strong enough to take the Emini down to the monthly moving average, which is below 1800.
S&P500 Emini intraday market update for price action day traders: bull trend reversal
Posted 6:55 a.m.
The Emini reversed up strongly from below yesterday’s low. Since this is after a strong sell climax yesterday, the odds are that the bulls will get a second leg up after a pullback. Because the Emini might still be in a trading range, pullbacks can be deep. However, as long as the bulls are able to keep the pullbacks from falling below the bottom of the bull reversal (the first bar of the day), the day will either be a trading range day or a bull trend day. The bears need to continue to form lower highs and lows to keep the bear channel intact. At the moment, the odds favor a trading range or bull trend over then next few hours. However, if the bears get a breakout below the low of the day, the day could become a big bear trend day.
The Emini was in a strong bear trend yesterday and was in a broad bear channel for the second half of the day. The bulls hope that the bear channel is a bull flag and they want a bull breakout. In about 70% of the time, this situation is followed on the next day by a 2 legged rally that lasts at least 20 bars. There is often follow-through selling in the first hour or so before the bull trend reversal begins. However, because of the extremely strong reversal down yesterday to the bottom of the 2 week trading range, the odds of the rally are less, and there was a significant risk of a gap down on the daily chart, which could have become a measuring gap.
Before the open comments on S&P500 Emini 60 minute, daily, weekly, and monthly candle charts: potential gap down, which could be a measuring gap
The Emini reversed down strongly yesterday. The bulls hope that this is the third leg down in a 60 minute triangle, and a test of the bottom of the trading range. The bears are hoping for either a bear breakout today or a gap down. If there is a gap down, it could become a measuring gap and be followed by a selloff of 40 points or more.
Today is a Friday so weekly support and resistance are magnets, especially at the end of the day. Last week’s low of 1918.25 and the daily 150 bar moving average, which is just below last week’s low, are support. The weekly moving average, which is around 1945, is resistance. The bears want a weekly close below support level, and they want the close to be far below those levels. They also want the weekly candle to close on its low. These would all be signs of selling pressure, and they would increase the chances of lower prices next week. The bulls want the opposite. If the bears fail to create signs of selling pressure, bears will be less willing to sell at the low and more interested in only selling higher. Also, bulls would be more willing to buy, betting that the attempt at a bear breakout will fail.
See the weekly update for a discussion of the weekly chart.
Traders can see the end of the day bar-by-bar price action report by signing up for free at BrooksPriceAction.com. I talk about the detailed Emini price action real-time throughout the day in the BrooksPriceAction.com trading room, and a 2 day free trial is available.
When I mention time, it is USA Pacific Standard Time (the Emini day session opens at 6:30 am PST, and closes at 1:15 pm PST). You can read background information on the intraday market reports on the Intraday Market Update page.

