Trading Update: Wednesday September 22, 2021
Emini pre-open market analysis
Emini daily chart
- Monday gapped down on daily and weekly charts and sold off strongly to far below the weekly bull channel and the 50-day MA.
- It reversed up from below the 100-day MA, the 4300 Big Round Number, and below the August 19 and the August 3 lows, which means the August low.
- Yesterday was a bear bar closing on its low. It is a Low 1 sell signal bar for today. The bulls, however, see it as a pullback from Monday’s strong reversal up from major support in a bull trend. Today’s FOMC statement report is a catalyst for a big move in either direction.
- Traders are deciding if a 15% correction to below 4,000 has begun or if the selloff is just another one of many sharp selloffs since the pandemic crash. Traders bought every one, and they soon had a new high.
- This is the 1st one to reach the 100-day MA since last October.
- Additionally, the monthly chart should have consecutive bear bars starting in September or October because of the unusual streak of bull bars.
- Therefore, this is different from all of the past selloffs. There is a 50% chance that September 2 will remain the high for 2021.
- The 50-day MA has been support since last year’s reversal up. Monday’s selloff fell far enough below so that it might now be resistance. The Emini might test it today before or after the FOMC report.
- There will probably be at least a small 2nd leg sideways to down within a week or so. However, if today’s FOMC announcement leads to a strong rally, Monday might be a V-bottom and the end of the selloff.
- If there is a new high within the next few weeks, it will probably fail above 4600. August would then be a Final Bull Flag.
- Since the 100-day MA was support on Monday, the Emini might have to go sideways for a couple weeks as traders decide if the 100-day support is more important than the 50-day resistance.
- It is common for a market to enter a trading range once it has a big reversal down from a buy climax. Traders then decide if the bull trend will resume or reverse.
Emini 5-minute chart and what to expect today
- Emini is up 25 points in the overnight Globex session.
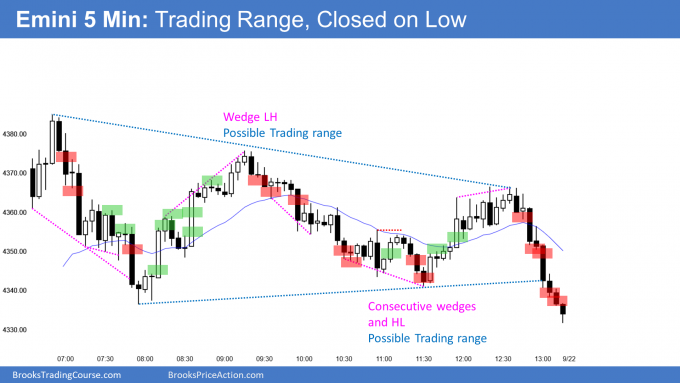
- Yesterday was a triangle and there was a small bear breakout at the end of the day. Today might open with a bull breakout after a failed bear breakout. That would increase the chance of a rally today.
- Today will open around the 60-minute EMA, which might be resistance.
- Magnets above are the 50-day MA on the daily chart and Friday’s low, which is the top of Monday’s big gap. Also, the midpoint of August is a magnet, and it is around those 2 other prices.
- There is an FOMC statement report at 11 am PT today.
- Trade the day like any other day until then, but day traders should exit ahead of the report. This is because there is a 75% chance of a big move in both directions in the 1st 10 minutes after the report.
- Day traders can resume looking for trades after the 1st 10 minutes.
- Be open to anything. A relentless trend for the rest of the day in either direction only happens 20% of the time.
- Therefore, expect at least one reversal.
- About 10% of the time, there is no significant move after the report and the Emini just goes sideways.
Yesterday’s Emini setups

Here are several reasonable stop entry setups from yesterday. I show each buy entry with a green rectangle and each sell entry with a red rectangle. Buyers of both the Brooks Trading Course and Encyclopedia of Chart Patterns have access to a much more detailed explanation of the swing trades for each day (see Online Course/BTC Daily Setups).
My goal with these charts is to present an Always In perspective. If a trader was trying to be Always In or nearly Always In a position all day, and he was not currently in the market, these entries would be logical times for him to enter. These therefore are swing entries.
It is important to understand that most swing setups do not lead to swing trades. As soon as traders are disappointed, many exit. Those who exit prefer to get out with a small profit (scalp), but often have to exit with a small loss.
If the risk is too big for your account, you should wait for trades with less risk or trade an alternative market like the Micro Emini.
EURUSD Forex market trading strategies
EURUSD Forex daily chart

- There is an FOMC statement report at 11 am PT. That usually results in a sharp move in both directions within the 1st 10 minutes. Therefore, day traders should exit ahead of the report and wait at least 10 minutes before day trading again.
- A FOMC statement report is sometimes a catalyst for a big move that can last for several days.
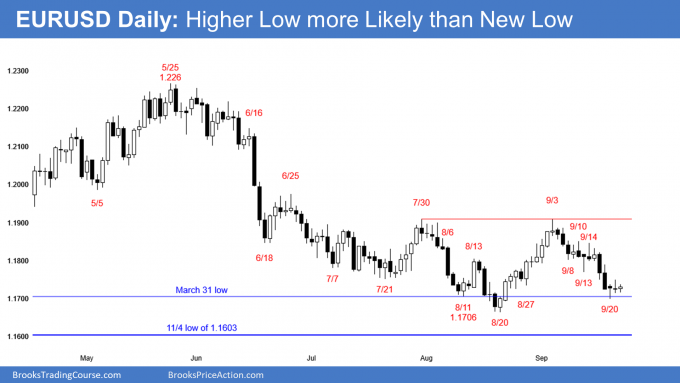
- Today so far is a small inside day and the past 2 days were also small after consecutive big bear bars closing near their lows. That is a Bear Surprise Breakout, and there is typically at least a small 2nd leg sideways to down.
- That 2nd leg is sometimes just a single bar.
- If today sells off and reverses up, it will create a micro double bottom with Monday’s low. If today then closes near its high, it would be a buy signal bar.
- Traders would wonder if the Bear Surprise was simply a bear trap and another test of the bottom of the yearlong trading range.
- A reversal up would be a higher low major trend reversal. A major reversal setup with a good signal bar has a 40% chance of actually leading to a trend reversal. In 60% of instances, it leads to a continuation of the trading range or a resumption of the selloff.
- Additionally, it would be the right shoulder of a head and shoulders bottom. The August 11 low would be the left shoulder and the August 20 low would be the head.
- Markets have inertia. They tend to continue what they have been doing.
- The EURUSD has been a 200-pip trading range for 4 months. That trading range is at the bottom of a 700-pip yearlong trading range.
- Since the EURUSD is near the bottom of both, there is an increase chance of a reversal up within a few weeks. It could come at any time.
- There might be a dip first below the November 4, 2020 bottom of the range.
- Traders will need a couple big bear bars closing on their lows and below that low before they concluding that the bear breakout was likely to succeed.
Summary of today’s S&P Emini futures price action and what to expect tomorrow

End of day summary
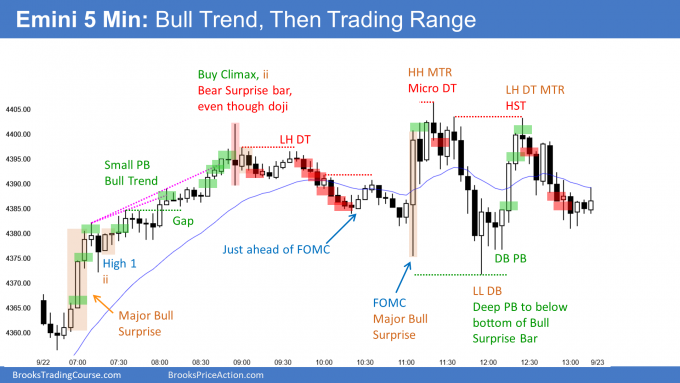
- The Emini began with a Major Bull Surprise and rallied in a Small Pullback Bull Trend. It was also a Spike and Channel Bull Trend.
- The rally ended with a big doji bar and a buy climax.
- There was a 2nd Major Bull Surprise Bar on the FOMC announcement. After a 1-bar 2nd leg up to just above the 4,400 Big Round Number and just below the top of the gap below Friday’s low, the Emini reversed down from a higher high major trend reversal.
- It was in a trading range since 9 am PT, and it remained sideways after the FOMC.
- It was a bull bar on the daily chart, but it had a big tail on top. This is a weak Low 1 sell signal bar.
- The Emini might have to test above the 50-day MA before the bears will try for a 2nd leg down.
- There is still a 50% chance that the rally will form a lower high and be followed by a 15% correction.
- If the bulls begin to get bull bars closing near their highs, the odds of another new all-time high will increase.
See the weekly update for a discussion of the price action on the weekly chart and for what to expect going into next week.
Trading Room
Traders can see the end of the day bar-by-bar price action report by signing up for free at BrooksPriceAction.com. I talk about the detailed S&P Emini futures price action real-time throughout the day in the BrooksPriceAction.com trading room. We offer a 2 day free trial.
Charts use Pacific Time
When I mention time, it is USA Pacific Time. The Emini day session charts begin at 6:30 am PT and end at 1:15 pm PT which is 15 minutes after the NYSE closes. You can read background information on the market reports on the Market Update page.


Thanks for the analysis it gives some idea of how to handle the news events.
As the markets were in strong buy in the past weeks it is very hard to trade bear setups . The quick reversal also keeps me out of the trade.