March FOMC today is major Emini catalyst
Updated 6:43 a.m.
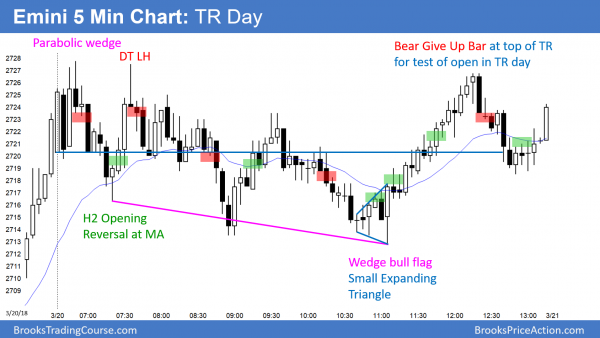
The Emini opened in the middle of yesterday’s trading range. This is a continuation of the range. The bulls created a reversal on the 2nd bar, which was a High 2 bull flag. However, the bar was a big doji, which is more of a limit order bar.
This is a trading range open, which increases the chance of a trading range up to the FOMC report. Since yesterday was small, today will probably go above yesterday’s high or below its low this morning. Yet, without consecutive big trend bars, the odds are that the breakout will fail.
If there are consecutive big trend bars and a breakout far above or below yesterday’s range, day traders will swing trade. Alternatively, if there is a small buy signal bar at the low or a small sell signal bar at the high, they will swing trade part of their position. Without that, they will scalp, and many will use limit orders.
Pre-Open market analysis
The Emini yesterday formed a trading range day. By closing above the open, it ended a 6 day streak of consecutive bear closes. It was also a bull inside day and therefore a buy signal bar. However, after 6 bear days, most bulls will not buy a breakout above yesterday’s high until after the 11 a.m. PST FOMC report. Because there is a new Fed Chairman and the Fed’s policy is changing this year, there is an increased chance of a big move up or down after the report.
The market usually gets neutral before a big news event. That reduces the odds of a big move prior to today’s report.
Overnight Emini Globex trading
The Emini is down 4 points in the Globex market. Yesterday was a trading range after a strong, late rally on Monday. It is therefore a bull flag. Hence, if there is a breakout before the report, it is more likely to be up than down. Since yesterday had a small range, the odds are that today will trade above its high, below its low, or both. At least one of the breakouts will probably come this morning.
Day traders will trade like on any other day until around 10:30 a.m PST. Many will then stop day trading and wait for the 11 a.m. announcement. A breakout after the FOMC report is usually big. It has a 50% chance of reversing within minutes. Most day traders should wait at least 10 minutes after the report before resuming trading.
Prior to 2 years ago, a trend after an FOMC announcement often lasted for the remainder of the day. Recent reports have more often led to trading ranges. Many have had brief big breakouts up or down after 12:30 p.m. If there is a trading range, day traders should watch for a late Buy The Close or Sell The Close trend.
Yesterday’s setups
Here are several reasonable stop entry setups from yesterday. I sometimes also show limit order entries and entries on the close of bars.
EURUSD wedge bull flag in middle of trading range ahead of FOMC
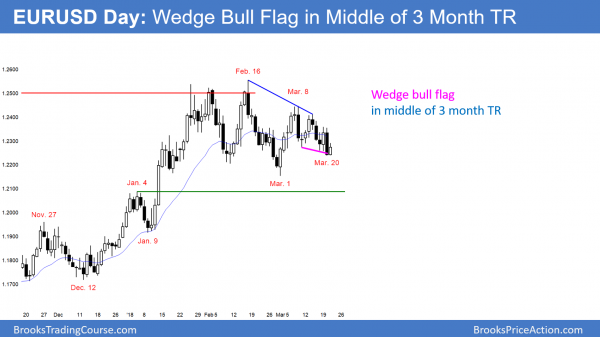
Over the past 3 weeks, the EURUSD daily Forex chart has pulled back from a 6 day rally. The pullback has 3 pushes down and is therefore a wedge bull flag. However, it is in the middle of a 3 month trading range. That lowers the probability of a bull breakout.
Today’s FOMC announcement that will probably lead to a big move up or down on the EURUSD daily Forex chart. It is more important than any current chart pattern. This is especially true because the daily chart is in the middle of a 3 month trading range. Neither the bulls nor the bears have had an advantage that lasted more than a week.
No matter what happens this morning, the 11 a.m. PST FOMC announcement will overwhelm all early movement. A small wedge bull flag means that there is a higher probability of at least a few days up over the next week. Yet, the probability is much closer to 50% because of today’s FOMC meeting. That means that there is also almost a 50% chance of a bear breakout below the bull flag and then a swing down to the March 1 low instead of up to the March 8 high.
Overnight EURUSD Forex trading
The EURUSD 5 minute Forex chart has been in a 30 pip range over the past 6 hours. While yesterday’s selloff was strong, the 50 pip rally up from yesterday’s low created confusion. The result is that a trading range is likely this morning. Also, since the FOMC announcement is so important, most day traders will take quick profits until the news. Therefore the odds of a big swing up or down this morning are small. In addition, most will stop trading about 30 minutes before the report.
However, surprises happen. If there is a strong breakout up or down in the next couple of hours, traders will hold for a swing. But, day traders should exit all positions before the report. Furthermore, 50% of FOMC reports create breakouts that reverse. Hence, day traders should wait for at least 10 minutes after the 11 a.m. PST report before resuming trading.
Summary of today’s S&P Emini futures price action and what to expect tomorrow
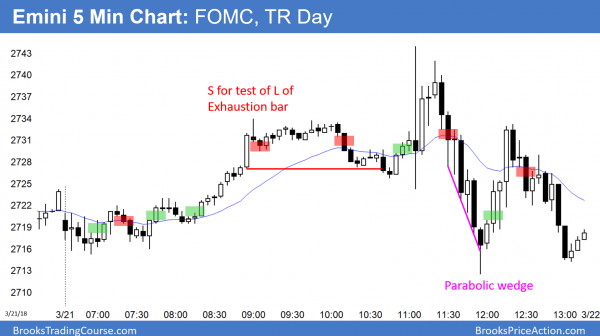
The Emini had a strong rally to above yesterday’s high before the FOMC report. It rallied more on the report, but reversed down from a micro double top just below Friday’s low. It then reversed back above yesterday’s high. Today is therefore both an outside down day and an outside up day.
Today rallied strongly on the FOMC report, but failed to close the gap on the weekly chart. Instead, it reversed down from a big expanding triangle, and then back above yesterday’s high. These repeated big reversals are a sign of confusion. The Emini is still deciding whether the sell signal or the buy signal on the weekly chart is in control. Since the monthly chart is in a strong bull trend, the odds favor the bulls.
See the weekly update for a discussion of the price action on the weekly candlestick chart and for what to expect going into next week.
Traders can see the end of the day bar-by-bar price action report by signing up for free at BrooksPriceAction.com. I talk about the detailed S&P Emini futures price action real-time throughout the day in the BrooksPriceAction.com trading room. We offer a 2 day free trial.
When I mention time, it is USA Pacific Standard Time (the Emini day session opens at 6:30 am PST, and closes at 1:15 pm PST). You can read background information on the intraday market reports on the Intraday Market Update page.


Hi Al,
Could you please clarify for me why the second bar of the day was a H2 please?
Kind regards
Simon
I don’t remember saying or writing that it was. However, the 3rd bar formed a complex High 2 with the 12:50 bar from yesterday. It was a H4.
Hi Al,
Sorry I should of been more specific, it was on the open and you wrote
‘The Emini opened in the middle of yesterday’s trading range. This is a continuation of the range. The bulls created a reversal on the 2nd bar, which was a High 2 bull flag.’
Kind regards
Simon
It was a H2, but it never triggered.
Al, you said “If there are consecutive big trend bars and a breakout far above or below yesterday’s range, day traders will swing trade.”
Do you mean that if it breaks out below yesterday’s low w big trend bars, traders will swing a fade (betting it’ll go back up)? Or did you mean that if we break below in trending bars, then traders will bet on swing lower? I think you meant the latter.
I’m confused because the context is rangey. Can you clarify?
Thanks!
Traders want evidence that the trading range price action has evolved into trending price action. That can come in many ways. For example, a breakout that has additional trend bars in the same direction, like after 8:30 PST. Alternatively, a reversal can do it, like the consecutive outside bars at 7:40. The 2nd was a big bull bar closing on its high. The next bar was also a big bull bar closing on its high. That increased that odds of a swing up. It was reversal up from a the test of the low, forming a higher low double bottom with the 5th bar of the day, and the consecutive bull bars were big and closed on their highs.