Posted 6:52 a.m.
After 2 days of extreme trending and bad limit order trading, the odds are that today will have a lot of limit order trading. Traders are uncertain and they will be quick to take profits. In the 1st 4 bars, both limit order bulls and bears made money. While it is likely that today will try to trick both bulls and bears into believing that another strong trend is underway, it is more likely that today will have both a swing up and down, and it probably will be an inside day. If there is a strong breakout either way, traders will not be in denial. However, most traders will be looking for a lot of trading range price action in the middle of the 2 big trend days.
Pre-Open Market Analysis
S&P 500 Emini: Learn to trade opposite candlestick patterns
The Emini had a 75% chance of at least 2 hours of sideways to down trading yesterday. it traded down all day. The bears saw a double top lower high major trend reversal on the 60 minute chart, and a Head and Shoulders top on the daily chart. The bulls saw a pullback from a strong 1st leg up on Tuesday from a wedge bottom on the 60 minute chart. They expect a higher low and then a 2nd leg up. That would create a Head and Shoulders Bottom bull flag.
The Emini is in the middle of a 2 month trading range and neither side has been able to maintain control for more than 2 or 3 days. There are both reasonable buy and sell setups. These are common in trading ranges, and the bulls and bears each have about a 50% chance of a successful breakout. Because a 2nd leg up is likely after a wedge bottom and yesterday’s strong selloff is still only a 50% pullback from the rally of the prior 3 days, the probability was slightly higher for the bulls coming into today, despite the strong selloff yesterday. The Globex is currently up 12 points.
Because yesterday ended with a sell climax, there is only a 25% chance of a strong bear trend day today. There is 50% chance of follow-through selling in the 1st 2 hours. There is a 75% chance of 2 hours of sideways to up trading that begins before the end of the 2nd hour.
The selloff at the end of the day was strong enough to make at least a small 2nd leg down likely. That might create a micro double bottom and it could be the start of the likely 2 hour sideways to up reversal.
The past 2 days had unusually big, relentless moves in opposite directions, and there are opposite signals. This is a Big Up, Big Down candlestick pattern. When that forms, the Emini usually chooses to stabilize into a trading range. However, because of the unusual moves of the past 2 days, day traders have to be prepared for another surprisingly big trend. I think that a trading range day is more likely.
Forex: Best trading strategies
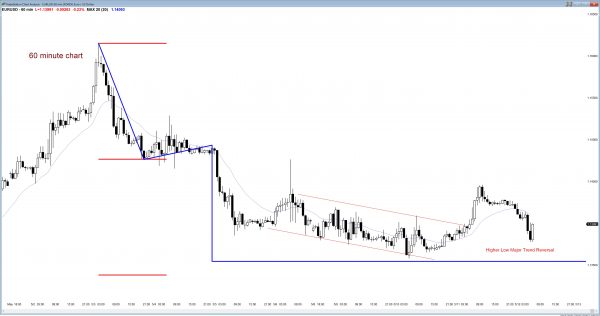
The 60 minute chart has a HL Major Trend Reversal, but in a tight trading range. More sideways trading is most likely.
The daily EURUSD Forex chart reversed up somewhat yesterday after 6 days down. Five of the 6 days were doji candlestick patterns on the daily chart, and dojis are more common in a bear leg in a trading range than in a bear trend. The odds are the the EURUSD will go mostly sideways today. The 1.1493 high of the May 5 sell climax bar is still a magnet and a possible top of the trading range over the next couple of weeks.
The Big Up, Big Down pattern on the daily chart, and now on the overnight 60 minute chart, will probably lead to a trading range that lasts at least few days. Since last week’s high was a wedge top and there has been only one leg down, the odds are that yesterday’s rally will test back down to create that 2nd leg sideways to down after last week’s wedge top.
It is important to remember that there is a sell setup on the weekly chart and a strong sell signal bar. Even though this is the 4th day of the week and this week has not sold off into a strong entry bar, it is still possible to get a very strong selloff by tomorrow’s close.
The daily chart is less bearing, There was also a wedge top, but the selloff has been finding support at the moving average and the April 21 high. It has formed a 5 day tight trading range instead of a relentless bear reversal. The selloff so far has been weaker than the rally. This makes at least another day or two of sideways trading likely.
On the 60 minute chart, the bulls hope that the strong selling of the past 2 hours is simply a higher low major trend reversal. Their case will be stronger if the rally of the past hour totally reverses the 2 hours of selling. After 4 sideways days and opposite signals, it is more likely that there will be disappointed bulls and bears, and the EURUSD Forex chart will instead go mostly sideways today. Remember, only 40% of major reversals actually lead to a reversal. Most are followed by a continuation of the trading range.
The bears want the selling to lead to a new low in the 2 week bear channel so that they will be reassured that the bear trend is still in effect. They need to do more than what they did overnight.
Summary of today’s S&P Emini futures price action and what to expect tomorrow
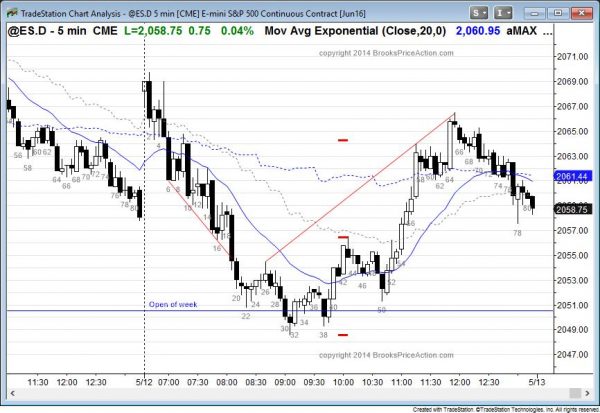
The Emini sold off in a series of sell climaxes, and then reversed up strongly.
The 60 minute wedge bottom from last week got its 2nd leg up today. The 60 minute chart now has a higher low major trend reversal (Head and Shoulders Bottom). The neck line is yesterday’s high. That might be too far to reach tomorrow.
The reversal up on the 5 minute chart was strong enough to probably lead to a measured move up tomorrow or early next week, despite the weakness in the final 2 hours. With the deep pullback, a Leg 1 = Leg 2 is the most likely type of measured move for tomorrow.
Tomorrow is Friday so weekly support and resistance are important. The nearest target is the open of the week, just above 2050.
See the weekly update for a discussion of the price action on the weekly candlestick chart and for what to expect going into next week.
Traders can see the end of the day bar-by-bar price action report by signing up for free at BrooksPriceAction.com. I talk about the detailed S&P Emini futures price action real-time throughout the day in the BrooksPriceAction.com trading room, and a 2 day free trial is available.
When I mention time, it is USA Pacific Standard Time (the Emini day session opens at 6:30 am PST, and closes at 1:15 pm PST). You can read background information on the intraday market reports on the Intraday Market Update page.


Hello Al.
I Hope you getting well. Thank you for commentary . Al would like to ask you if you have time would you please analysis to us the USDCAD pair .
Thank You.
Best Wishes .
Al, In the last paragraph on the e-mini section did you mean Big Up, Big Down? Otherwise I am confused!
Thanks,
I fixed it.
Thanks!