Posted 7:05 a.m.
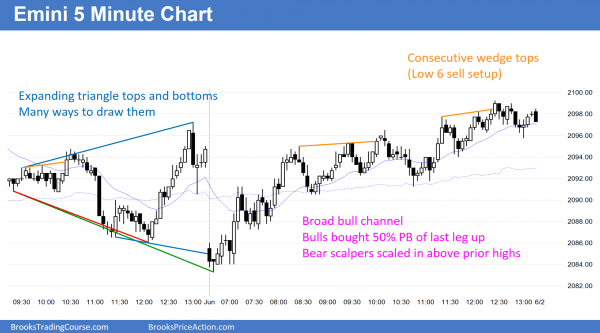
The Emini reversed up from below yesterday’s low, forming an expanding triangle bottom. However, the early bars were small and had prominent tails. This is trading range price action. The context is good for the bulls, but they need a strong bull reversal before they will swing trade. The bears see the big swings of the past 4 hours and are hesitant to sell too low. Traders are scalping while waiting for a strong breakout up or down. All 3 moving averages are flat and close together, which increases the chances of a lot of trading range price action. Although the Emini is Always In Long, the bulls need stronger bars before traders will swing trade. Today probably will have a lot of trading range price action. While a bear trend day is possible, it is not likely. If there is a bull trend, it will more likely be a bull swing that will later be followed by a bear swing or a trading range. This is not a strong trend type of open, but the bulls are currently in control.
Pre-Open Market Analysis
S&P 500 Emini: Learn how to trade bullish breakout price action
Yesterday was the last day of May. Although the Emini rallied up from below the April low and came close to forming an outside up month, it failed at creating this sign of strength for the bulls. May is now a buy signal bar because it is a pullback from the April breakout to a new all-time high above the 2 year trading range. The April breakout was a small bull bar that closed below the top of the trading range and therefore the breakout was weak.
Most trading range breakouts fail. So far, the bulls have not done enough to convince traders that the breakout will succeed. Even though May is now a buy signal bar, many traders will not buy above the May high (which is yesterday’s high) because the April breakout was weak, and buying above May is buying at the top of a trading range. Traders know that most trading range breakouts fail.
The higher probability trades are to buy a pullback below the top of the range, or to buy a strong breakout above the range. Any buy tomorrow above the May high is a low probability bet on the monthly chart. However, if there is a strong breakout on the 5 minute chart, it can lead to a good trend for the rest of the day for day traders. Traders trading the monthly chart need a big breakout far above the 2 year range before they believe that there will be a 300 point measured move up.
The rally on the daily chart last week was strong enough so that traders will probably buy a 1 – 3 day pullback. The weekly chart pulled back for the past 4 weeks after an 11 bar bull micro channel. As expected, the bulls bought the pullback However, a rally after a pullback from a bull micro channel usually is followed by a trading range within about 5 bars. This means that the odds of a strong bull breakout on the weekly chart lasting more than a few weeks are less than 50%.
Yesterday was an outside day on the daily chart. An inside day often follows an outside day. If today is an inside day, it will create an ioi breakout mode setup on the daily chart for Thursday.
Although the rally at the end of yesterday was strong, it failed to get above yesterday’s high, 2100, or the April high. However, it was strong enough so that bulls will probably buy the 1st pullback on the daily chart.
The Globex chart is down about 7 points and is near yesterday’s low. The bulls want a double bottom with yesterday’s low. The bears want a double top with the April high, and then a breakout below the May 19 neck line and a measured move down. This 1st reversal down from last week’s rally will probably be bought, and the bears will probably need a micro double top with yesterday’s high before they will have a good chance at a reversal down.
Forex: Best trading strategies
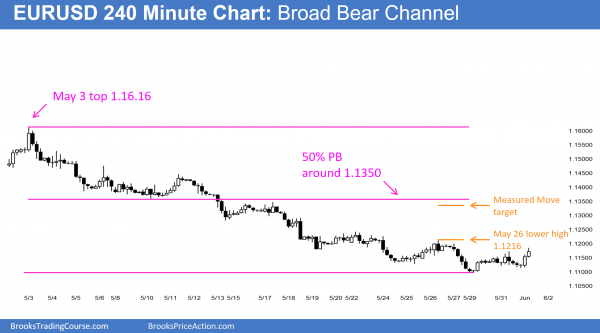
The 240 minute EURUSD Forex chart formed a higher low major trend reversal in a broad bear channel. The bulls need to break above the May 26 lower high to end the bear trend.
The daily chart of the EURUSD Forex market fell 3 pips below 1.1100 on Monday, and 7 pips below the measured move target. It did so with 5 consecutive sell climaxes. The odds are that there will be a rally for a week or two that will retrace about 50% of the selloff of the past 4 weeks. A 50% pullback from the selloff is about 200 pips.
The March 16 low of 1.1057 is still 40 pips below Monday’s low. Since it is the bottom of the bull channel that formed after the strong March 10 bull reversal, it is still a target for the bears. The bottom of the 1st pullback often gets tested. There are usually buyers there, and the selloff after the bull channel usually bounces. The bounce creates a trading range.
Can the EURUSD Forex chart continue down or even accelerate down? That is not what usually happens after a series of 4 – 5 sell climaxes, and it is not what usually happens when the EURUSD is pulling back after a Spike and Channel bull trend. A bounce and then a trading range is a more likely outcome.
The EURUSD Forex chart is in a buy zone for a 200 pip rally. Monday is a reasonable buy signal bar, but yesterday was the entry bar and it was weak. The bulls bought the breakout below the May 19 and 25 lows for a scalp up. Yesterday is a sell signal bar. It was a doji and therefore a weak sell signal, and it is forming after a series of sell climaxes. The bulls were confident enough to buy the breakout below the 1 day bear flag overnight. They bought yesterday’s low and did not wait for a breakout below the bottom of the bull channel to buy (Monday’s low). This is a sign of strength and it might be the start of the 2 week bear rally.
The EURUSD 60 minute Forex chart is in a broad bear channel. A broad bear channel usually evolves into a trading range. There is no clear bottom yet, but once a channel has had several legs down, bears begin to take profits at new lows and no longer sell the breakout to a new low. This happened overnight, and created a Higher Low Major Trend Reversal. Again, the odds are that any reversal up over the next couple of weeks will be a bull leg in a trading range, and it will probably be sold. However, a bear rally often retraces 50% of the selloff. If so, that would be about 200 pips.
The bulls need the rally to get above a major lower high in the bear channel on the 60 minute chart. The first target is the May 26 lower high of 1.1216. If it does that, the 60 minute bear trend will have ended. The 60 minute chart would then be in a trading range and possibly a bull trend (the bear rally on the daily chart).
The EURUSD rallied overnight, but it is still below the May 26 high, and it might be forming an expanding triangle bear flag. Bears will sell in this area because they want the lower high. Bulls want the breakout above the lower high to end the 60 minute bear trend. If they succeed, they will then look for a measured move up. The overnight rally was not especially strong and it did not get above the major resistance of the May 26 high. At the moment, it is still a bear rally in a bear channel. However, the rally has lasted 70 pips, which means that bulls are holding onto their positions longer.
The May 26 high is about 30 pips above. Bulls might become cautious here and start to scalp out of longs. Bears will begin to sell. Unless the rally strongly breaks above that high, a trading range will probably begin to form on the 5 minute chart, and traders will then mostly scalp.
Look at the weekly chart. There are 4 consecutive bear bars after a wedge top. The odds are that there will be sellers above the prior week’s high, and that any reversal up will be minor. A minor reversal is one that usually leads to a leg in a trading range instead of an opposite trend. This is consistent with the daily and 60 minute charts, which are also likely to soon enter a trading range.
Day traders will begin to look for buy setups for swing trades. Until there is a strong bull breakout, they will probably be quick to take profits. Those trading the 60 minute and daily charts will begin to use wide stops and hold for a 200 pip rally, which should begin this week.
Summary of today’s S&P Emini futures price action and what to expect tomorrow
The bulls reversed up from an expanding triangle below yesterday’s low in a broad bull channel.There were many ways to draw the triangle tops and bottoms. There were also consecutive wedge tops.
After each new high, bulls bought a 50% pullback. Bear scalpers sold each new high. The bulls on the daily chart have enough momentum for a test of the all-time high, which might take place this week. The bears on the daily chart probably need at least a micro double top. It tomorrow reverses down, it would be a sell signal bar after the bears have achieved their minimum goal of creating a micro double top. However, the odds are that the Emini will test the all-time high within the next several days.
See the weekly update for a discussion of the price action on the weekly candlestick chart and for what to expect going into next week.
Traders can see the end of the day bar-by-bar price action report by signing up for free at BrooksPriceAction.com. I talk about the detailed S&P Emini futures price action real-time throughout the day in the BrooksPriceAction.com trading room, and a 2 day free trial is available.
When I mention time, it is USA Pacific Standard Time (the Emini day session opens at 6:30 am PST, and closes at 1:15 pm PST). You can read background information on the intraday market reports on the Intraday Market Update page.


