Posted 6:58 a.m.
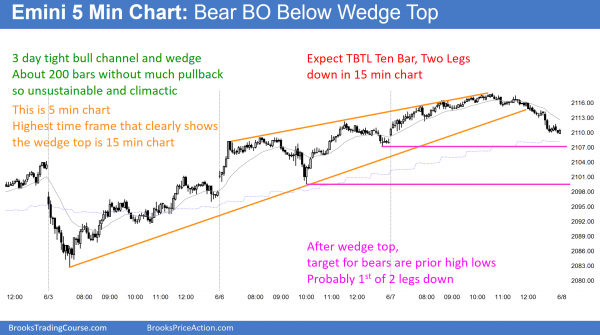
Yesterday spent a lot of time in tight trading ranges, and today began with limit orders bulls and bears making money. This is trading range price action, and it increases the chances of a lot of trading range price action for the rest of the day. Traders will be inclined to scalp and enter with limit orders until there is a strong breakout up or down. The bears have a wedge top, which could lead to a swing down and a couple of legs down. The bulls have a bull channel with magnets above, which could lead to a swing up.
Today will probably not be a trend day. This means that if there is a swing up or down for 2 – 3 hours, it will probably be followed by an opposite swing in the middle of the day.
Pre-Open Market Analysis
S&P 500 Emini: Learn how to day trade expanding triangle tops
The Emini made another all-time high yesterday. The cash index is still 21 points below its all-time high, which is a magnet. It might instead form a double top lower high with the November high of 2116, which is only 3 points above today’s high. It is too early to know if the cash index will make a new high and if it will form a double top with the old high from May 2015 or with the November high. However, the cash index is creating resistance for the Emini at about 3 and 21 points above today’s high, around 2015 and 2033.
There are problems with the Emini breakout to a new high. The weekly chart had a buy climax in April and is now testing above that high; when that happens, a trading range usually follows. The monthly chart tried and failed to create an outside up month in May. The daily chart failed on several opportunities over the past week to gap up to a new high. Yesterday’s breakout on the daily chart was not strong. There is a nested expanding triangle on the daily and 60 minute charts. Finally, most trading range breakouts do not go far before failing. All of these factors make it likely that the bulls will be disappointed and will sell out of their longs within a few weeks. If so, the pullback might test down to the bottom of the 3 month trading range (expanding triangle top) at the April low, which would be about 80 – 100 points down.
The bears will probably buy puts and put spreads this week, betting on the pullback. They know that the odds are that the Emini will rally at least a little more, but they want to have their position on in case there is a Black Swan selloff, which would make it difficult to then put the position on. They will trade small enough so that they can add on 10 – 20 points higher, but they would only do so if the continued rally did not convert into a strong bull breakout.
The Emini is up 3 points in the Globex market. Traders should expect a reversal over the next couple of weeks that will probably test the April low, which is the bottom of the expanding triangle.
Forex: Best trading strategies
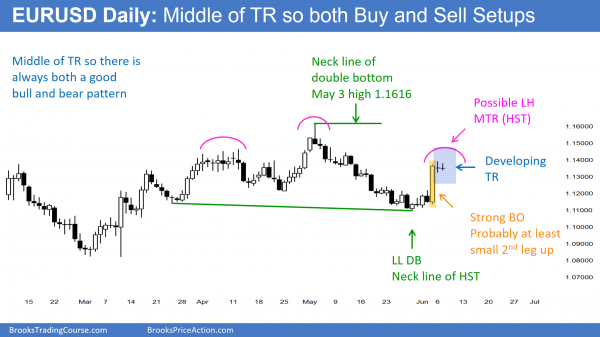
The daily EURUSD Forex chart is in the middle of a trading range that began with the pullback from the bull reversal in early March. There is a Lower High Major Trend Reversal (LH MTR). A LH MTR is usually also a Head and Shoulders Top (HST). There is also a Lower Low Double Bottom (LL DB). All trading ranges always have credible buy and sell setups.
I mentioned yesterday that the EURUSD daily Forex chart would probably be mostly sideways for at least a few days after Friday’s buy climax. This is what often happens after a buy climax, and it is more likely because the rally reached the 1350 target that I have been writing about for a couple of weeks, and because it is now in the middle of its 3 month trading range. As always, if there is a strong breakout up or down, online day traders will swing trade. However, it is more likely that the range will be small for at least a couple of more days, and day traders will mostly scalp. The overnight range has been about 40 pips, which is narrow and a scalper’s market.
Summary of today’s S&P Emini futures price action and what to expect tomorrow
The Emini rallied in a small pullback bull trend to another new high, and then reversed down from a lower high major trend reversal.
The cash index went slightly above the November lower high and then reversed down. The bears want a double top lower high major trend reversal on the daily chart of the cash index. The bulls want today’s selloff to be only a pullback on the way to a new all-time high. Because of all of the reasons I mentioned this morning (see above), the Emini probably has limited upside over the next month and it might test down to the April low.
The bears got a reversal today, but it was not especially strong and it held above the 60 minute moving average. The bears need much more follow-through selling before traders believe that they have taken control on the daily chart. The location is good for the bears, and so are the overbought 60 minute, daily, and weekly charts. However, the bears need a strong bear breakout. Otherwise, a trading range is more likely than a swing down over the next few days.
The largest time frame that shows the wedge is the 15 minute chart. Therefore, the TBTL Ten Bar, Two Leg minimum goal for the selloff is on the 15 minute chart. The selloff at the end of the day will probably be the 1st of at least 2 legs down.
See the weekly update for a discussion of the price action on the weekly candlestick chart and for what to expect going into next week.
Traders can see the end of the day bar-by-bar price action report by signing up for free at BrooksPriceAction.com. I talk about the detailed S&P Emini futures price action real-time throughout the day in the BrooksPriceAction.com trading room, and a 2 day free trial is available.
When I mention time, it is USA Pacific Standard Time (the Emini day session opens at 6:30 am PST, and closes at 1:15 pm PST). You can read background information on the intraday market reports on the Intraday Market Update page.


Thanks