Posted 6:54 a.m.
The early selloff made it likely that the 2 hours of sideways to down trading that I was expecting has already begun and that today will not have early follow-through buying. The odds favor a trading range that lasts at least a couple of hours. Since it probably began yesterday with the steep selloff just after noon, there might not be much left to the range, and the bulls might get bull trend resumption. However, the selling yesterday was so strong and happened so often that the odds are against an early strong rally. A trading range is likely for the 1st couple of hours today.
While the bear breakout on the open was big compared to most days, it was small compared to yesterday’s swing and this makes it more likely that it is a probe down to find the bottom of the range. It might lead to a bear trend day, but with so many big reversals yesterday, the market is telling us that it is confused. When that is the case, a trading range is more likely than a trend. Because yesterday had big swings, today will probably also have at least one swing up and one swing down. Day traders will look for reversal setups and strong breakouts. There is no bottom yet, but the selloff is not strong and it is probably a bear leg in what will become a trading range.
Pre-Open Market Analysis
S&P 500 Emini: Learn how to day trade a buy climax top
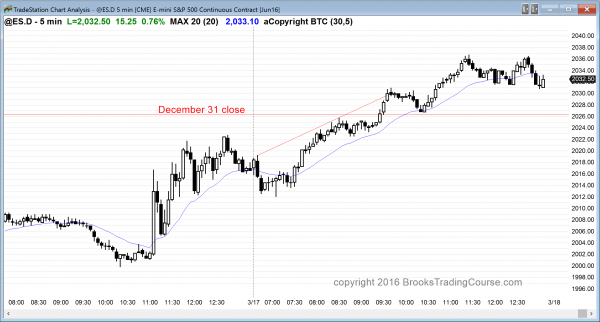
The Emini rallied strongly on the report, but nothing has changed. It closed the gap below the December 31 low, and is trying to test the December 31 close, to erase the losses of 2016. Nothing has changed. I wrote yesterday that there might be a rally of about 3 days after the report, but there is still a 70% chance of a 50 – 100 point correction beginning after that small rally.
The rally since the February 24 low will probably end up as a bull leg in a trading range that will last at least a month, and fill in the gap (see my weekend post) between the 2 upper and 2 lower trading ranges on the daily chart. There is a 30% chance that the rally will continue up for 2 or more weeks without the trading range beginning to form.
My day trading tip for online day traders is to watch for a bear breakout within the next few days. It should provide a good swing down on the 5 and 60 minute charts. The Emini should begin to create big bear trend days, which would represent the bulls giving up and the bears getting aggressive (Give Up bars). Bear trend days at the start of a swing down on the daily chart often look only mildly bearish for most of the day. Many sell off strongly at the end of the day, and day traders should be prepared for big swing trades forming in the last hour or two during the next week or so.
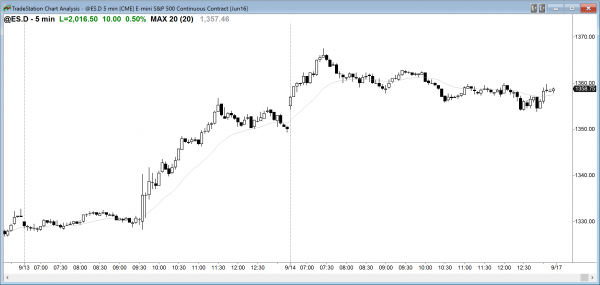
This is September 14, 2014, the day after a strong rally on an FOMC report. There was follow-through buying on the open, but the parabolic wedge top became the high of the next 4 months.
I do not know if the high today or in the next few days will be the high of the next 4 months. However, the chart illustrates the point that a strong rally is often a buy climax at the end of a bull trend. Even though yesterday was strong, there is a 70% chance that it is setting up a reversal, and the minimum goal is a trading range that will last at least a month and fall 50 – 100 points.
After a strong rally like yesterday, there is a 50% chance of early follow-through buying, which would give put and put spread buyers a good entry. There is also a 75% chance of at least a couple of hours of sideways to down trading that begins before the end of the 1st 2 hours. The swings down should be getting good within the next 3 days so day traders should not be in denial once they begin. There is only a 30% chance of it not happening.
Forex: Best trading strategies
The EURUSD rallied strongly after yesterday’s FOMC report and it is testing the resistance of the February 11 lower high in the yearlong trading range. The daily chart has a nested wedge. There were 3 pushes up since the December 3 low, and the 3rd push up that began on March 2 has 3 smaller pushes up. This increases the chances of a reversal, but there is no top yet.
Also, I said last week that the strong reversal up on March 10 would probably have at least one more leg up after a pullback. The rally that began yesterday meets that minimum goal. This does not mean only one more leg up, and there is no sign of a top. However, whenever there is a 2nd leg up in a trading range, no matter how strong the rally, traders have to remember my 80% rule, which says that 80% of breakout attempts within trading ranges fail (and 80% of reversal attempts in trends also fail).
The bulls need a strong breakout above the February, October, and especially August lower highs before those who trade the markets for a living will believe that the EURUSD is reversing up after the 2014 bear trend. The odds are against the bulls, but all trading ranges eventually end, and one of the breakout attempts will eventually succeed.
The math is much better betting that every one of them will fail. Only after one finally clearly succeeds should traders begin to trade the EURUSD like a trend, and become willing to hold positions for weeks at a time. Until then, most traders will look for trades lasting only a few days and take quick profits.
The 5 minute chart has been pulling back in a bull flag for the past 3 hours, and has just begun to break out of the bull flag. Because of the series of buy climaxes on the 60 minute chart since the March 10 bull reversal, the odds are that a trading range will develop soon. This is especially true because that rally since the March 2 low has 3 pushes up (a wedge), it is testing a prior high (February 11), and it is around a measured move up from the March 10 gap.
That gap was created by the March 16 low testing the March 8 high. The March 10 rally was the gap. While there was no actual gap, whenever there is a reversal up from support with little or no overlap, I refer to that space as a gap, and it usually is followed by a measured move up and therefore is a variation of a measuring gap.
Strong rallies usually transition into trading ranges before they can reverse. The best the bears can hope to see is a trading range for the next couple of days. Since the odds are against a strong bull breakout above the February high when the rally has a series of buy climaxes, the odds are that the 5 minute chart will start to form a trading range today or tomorrow on the 60 minute chart. As long as the trading range has 20 or fewer bars, the odds still favor a bull breakout and at least one more small leg up.
Summary of today’s S&P Emini futures price action and what to expect tomorrow
The Emini broke strongly above the December 31 close. The breakout was big enough so that the first test down will probably be bought. However, the odds still favor that the Emini will be evolving into a trading range within the next few days, and that today’s buy climax will probably be near the top of that range. Less likely, the rally will continue strongly up to the all-time high.
This is a good location for the bears (the bottom of a 3 month trading range), and the buy climax also reduces the chances that the Emini will go much higher without 1st entering a trading range for a month or more. The bulls have momentum on their side, but because the Emini is so overbought on the 60 minute, daily, and weekly charts, the Emini will probably evolve into a trading range within the next few days.
See the weekly update for a discussion of the price action on the weekly candlestick chart and for what to expect going into next week.
Traders can see the end of the day bar-by-bar price action report by signing up for free at BrooksPriceAction.com. I talk about the detailed S&P Emini futures price action real-time throughout the day in the BrooksPriceAction.com trading room, and a 2 day free trial is available.
When I mention time, it is USA Pacific Standard Time (the Emini day session opens at 6:30 am PST, and closes at 1:15 pm PST). You can read background information on the intraday market reports on the Intraday Market Update page.


