FOMC Fed rate hike after parabolic wedge buy climax
Updated 6:52 a.m.
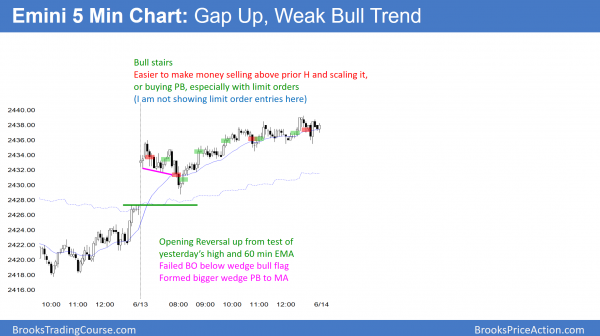
The Emini gapped above yesterday’s high, but turned down from just below the all-time high. Because yesterday’s bull channel was tight, the bears need a series of strong bear bars to convince traders that they have begun a swing down.
Despite the 2 early bear bars, limit order bulls made money buying below the 1st bar. Furthermore, most days over the past several weeks had early trading range trading. Finally, yesterday was mostly a trading range day. Consequently, most traders will be hesitant to sell low unless their is follow-through selling.
While the Emini is Always In Short, this is a trading range open. The odds are against a strong bull trend day, at least until after the FOMC report. Yet, because the bulls made money and the bears failed to get strong follow-through selling, the odds are against a strong bear day. Therefore, this will probably be a trading range or weak bear trend for the 1st couple of hours. Since yesterday’s range was small, there is an increase chance that today will be an outside day.
Pre-Open market analysis
While yesterday gapped up, it was still below Friday’s high. Therefore the bears can create a lower high. Furthermore, it was the 7th consecutive doji day on the daily chart. The Emini is therefore neutral going into today’s FOMC meeting. Traders do not care if the Fed raises interest rates. All they care about is whether there will be a trend up or down after the announcement.
Prior to a couple of years ago, the FOMC announcement usually led to strong trends. Recently, they have led to trading ranges. However, the trading ranges usually had at least a brief breakout by the end of the day. A trading range is more likely tomorrow because of 7 consecutive dojis on the daily chart. But, traders will trade what is there, not what is most likely.
Overnight Emini Globex trading
The Emini is up 3 points in the Globex market. If it opens here, it will be within a point of last week’s 2343.50 all-time high. While the momentum up on all higher time frames is strong enough to make higher prices likely, the extreme buy climax on the weekly chart makes a 100 point correction likely at any time. The bears want a reversal down from around the all-time high. Yet, until there is a reversal, the odds favor higher prices.
Because today is an FOMC announcement day, the Emini will probably enter a tight trading range for an hour or two before the 11 a.m. announcement. Traders should stop trading before the report.
Since the breakout on the announcement has a 50% chance of reversing within 2 bars, traders should wait to trade for at least 10 minutes after the report. If there is a strong breakout up or down, traders should look to swing trade. However, over the past two years, the Emini has been mostly sideways with many sharp reversals after FOMC announcements. Traders need to be careful to trade what is on the chart in front of them and not what they hope the chart will become. If there is not a clear strong trend, most traders should wait.
Yesterday’s setups

Here are several reasonable stop entry setups from yesterday.
EURUSD Forex market trading strategies
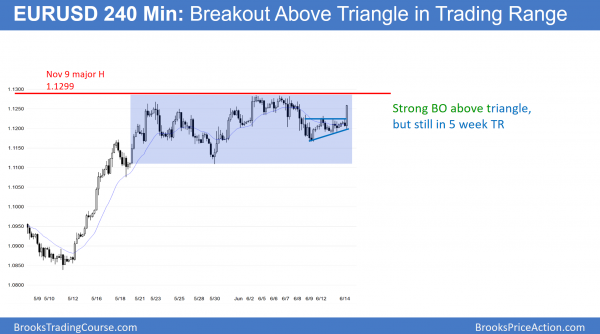
The 240 minute EURUSD Forex chart broke above a 3 day triangle within a 5 week trading range. The bulls are hoping that this is the start of trend resumption up and a break above the range.
The EURUSD Forex market rallied strongly in May, but stalled just below the November 9 major lower high. It has been in a trading range for 5 weeks. The momentum up was strong enough to make a break above that high likely. The break above the 3 day range is strong enough to have at least a small 2nd leg up today. Yet, until there is a breakout, there is no breakout. Trading ranges constantly try to breakout. However, most breakout attempts fail.
Since the FOMC report today will affect all financial markets, there is an increased chance that the breakout or a strong reversal down will come today. The odds favor the breakout above the November high either today or within a week.
Overnight EURUSD Forex trading
The EURUSD Forex market rallied 60 pips over the past hour and broke above its 3 day triangle. The breakout is strong enough so that bulls will buy the 1st pullback. Furthermore, the odds favor a break above the November major high within a week or so.
Yet, because today’s FOMC announcement is very important, this breakout could quickly reverse after 11 a.m. Even though the bull breakout is more likely, traders have to be prepared for the opposite. If there is a strong reversal down after the report, traders will swing trade their shorts. Most financial markets enter a trading range an hour or two before the FOMC announcement, and that is what is likely today.
Summary of today’s S&P Emini futures price action and what to expect tomorrow
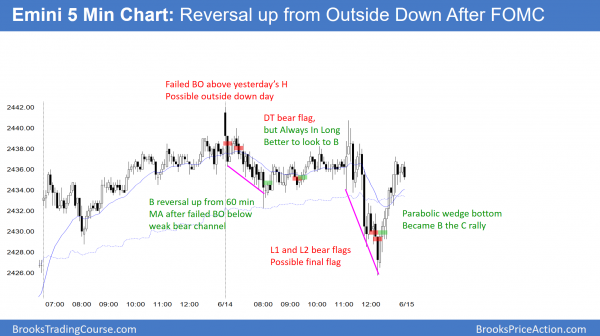
The Emini was sideways into the FOMC announcement. After a parabolic wedge selloff on the report, it reversed up from a 2nd failed breakout below yesterday’s low.
The Emini is still in its 2 week trading range. While it has both a parabolic wedge top and a wedge top on the daily chart, there is no reversal yet. The weekly chart is extremely overbought. Therefore the odds are against much more of a rally without a pullback to the weekly moving average.
See the weekly update for a discussion of the price action on the weekly candlestick chart and for what to expect going into next week.
Traders can see the end of the day bar-by-bar price action report by signing up for free at BrooksPriceAction.com. I talk about the detailed S&P Emini futures price action real-time throughout the day in the BrooksPriceAction.com trading room. We offer a 2 day free trial.
When I mention time, it is USA Pacific Standard Time (the Emini day session opens at 6:30 am PST, and closes at 1:15 pm PST). You can read background information on the intraday market reports on the Intraday Market Update page.


Hi Al,
I’m trying to follow your daily commentary on the market’s price action very carefully. But I would appreciate some clarity on how to square your commentary with your end-of-day “E-mini 5-Min Chart” you post here at the end of each day.
For example, today at Bar #2 you said in your commentary this morning: “buyers at 1 low or 1 pt. lower; prefer strong follow through selling, it’s Always in Short; good bar for bears (referring to Bar #1); need more to sell; possible small 2nd leg down”
But on the chart you displayed at the end of the day, you showed a sell signal below bar #1. After listening to your commentary I was reluctant to take a short on a stop. I didn’t take the trade but it would have turned out successfully for a scalp or a 2X traders equation with a stop above bar #1
At bar #7 your comment was: “Not yet high probability trading; limit order so far.”
So I did nothing.
But on the chart you showed a sell stop just below Bar #6 with a good 2X trader’s equation profit using an actual stop above bar #6.
Am I missing something in the commentary or misinterpreting the commentary that will help me to actually take a trade?
Any advice would be appreciated. Many thanks in advance
Bob
@Bob: imho, the main difference might be that the EOD-chart does not include limit order entries. I’d assume “buyers below 1” at late TTR as support refers to limit buyers; a stop sell below 1 would mean big bar, big risk but no FT yet. “Not high prob at 7” doesn’t mean “no trade” but “not very likely to be successful”, so better limit, or stop w/multiple R – due to lots of overlapping, tails = messy. Just my 2 cents…