Emini weekly sell signal bar before Wednesday’s FOMC announcement
Updated 6:47 a.m.
The Emini opened with consecutive bull bars breaking above yesterday’s 2 hour bull channel. Yet, both had tails and stalled at the 60 minute EMA. At the moment, the Emini is Always in Long, but the bulls need a strong breakout above the 60 minute EMA and then above yesterday’s high.
With 6 consecutive bull bars since the end of yesterday, the odds are against a bear trend day. Yet, the past 2 days had strong rallies that failed. The days went sideways. There is therefore a risk of a deep pullback again today.
At the moment, today is in a bull trend. However, if there is a deep pullback, today could be another trading range day. With 6 consecutive bull bars and many bottom attempts for 2 days, a bear trend is unlikely.
Pre-Open market analysis
The Emini had a trading range day yesterday, but it closed with a bear body. It was the 4th consecutive bear day. This therefore slightly increases the odds of a selloff down to the March 2 low. However, next Wednesday’s 11 a.m. FOMC meeting is more important. The odds are against a big move before the announcement.
Yesterday was the 1st time this year when there was a 4th consecutive bear bar on the daily chart. If the Emini is now in a bear trend, then this streak could continue. However, it is more likely in a trading range. Consequently, today will probably have a bull body.
This means that today will probably close above the open. Therefore, if the Emini is 5 points or less below the open in the final hour, it will probably rally to back above the open. In addition, if it is above the open and sells off in the final hour, it will probably bounce at the open.
Today is the last day of the week. Its close therefore affects the appearance of the weekly chart. Since the open of the week is far above, the week will probably have a bear body. The bears will try to get the week to close near its low. That would make this week a stronger sell signal bar for next week.
Overnight Emini Globex trading
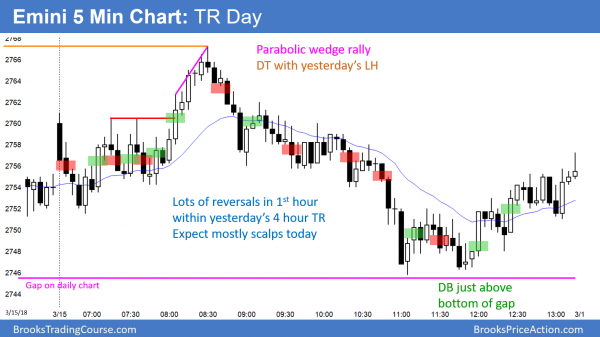
The Emini is up 3 points in the Globex market. It reversed up repeatedly over the past 2 days in the 2750 area. Yet, it was unable to create a sustained rally.
Today will probably close above its open. Therefore, traders will look for either of 2 things today. First, there could be a rally from the open. Alternatively, there could be a 1 – 3 hour selloff and then a reversal up to above the open by the end of the day.
There is always a bear case. The bears hope that the 4 consecutive bear closes are the start of a bear trend down from the February 27 high. The odds are against it. However, if it is, the bears will try to break strongly below 2750 and create a big bear trend day. Consequently, while the odds favor an up day, if the opposite is unfolding, traders need to swing trade their shorts.
This is because the biggest trends come on days when they are unlikely. Traders get mentally trapped into thinking the opposite should be happening. This is true of the computer algorithms as well. They continue to make trades in the wrong direction, and repeatedly have to exit with a loss, adding to the growing trend.
Yesterday’s setups
Here are several reasonable stop entry setups from yesterday. I sometimes also show limit order entries and entries on the close of bars.
EURUSD at apex of triangle ahead of FOMC
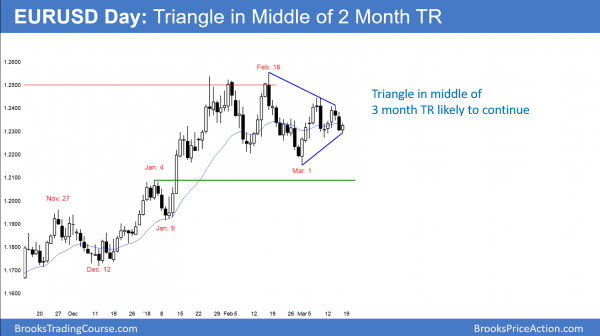
Today is forming a small double bottom bull flag on the EURUSD daily Forex chart. More importantly, it is at the apex of a triangle in the middle of a 3 month trading range. It is therefore neutral.
The EURUSD daily Forex chart is neutral ahead of Wednesday’s FOMC announcement. While there is a small double bottom after a 6 bar rally 2 weeks ago, the chart will more likely stay between 1.23 and 1.24 for several more days.
This week so far is a doji bar on the weekly chart, and it followed 2 other doji bars. This is neutral trading, and markets resist changing their current behavior. Trends last a long time, and so do trading ranges. Therefore, the odds are that this week will close near the 1.2311 open of the week. That means the 1.2311 will be a magnet today.
Overnight EURUSD Forex trading
The EURUSD 5 minute chart has been in a 15 pip range for the past 4 hours. This is extremely unusual and therefore there will be a breakout sometime this morning. However, the odds of a big move up or down are small. Most day traders will not trade when the range is only 15 pips. Hence, they will wait for the breakout.
The daily chart so far has a bull body and a small double bottom after a 2 week rally. However, the odds are that this week’s candle on the weekly chart will not have a big body when the week closes today. Therefore, any breakout today will probably not get far. All financial markets will probably be quiet ahead of next Wednesday’s FOMC announcement.
Summary of today’s S&P Emini futures price action and what to expect tomorrow
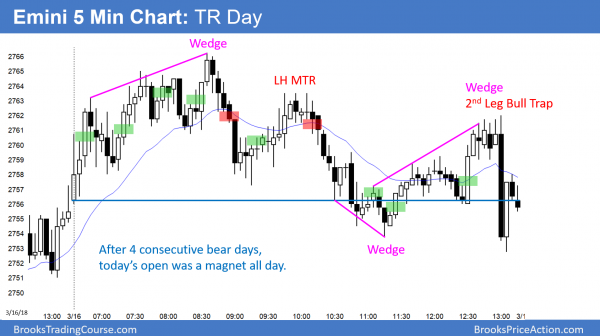
The Emini was in a quiet trading range day today. There was wedge top and then a wedge bottom. With the close below the open, today was the 5th consecutive bear day.
Today was the 5th consecutive bear day. This is the 1st 5 day streak in 6 months. The odds are that Monday will have a bull body. Therefore, traders will expect either an early bull trend, or that any selloff will reverse up and get above the open by the end of the day.
Because today was a doji, it is also a buy signal bar for Monday. However, after 5 bear days, any rally will probably stall after 1 – 2 days.
This week ended with a bear bar on the weekly chart. It is therefore a Low 2 sell signal bar for next week. The odds are that next week will trade below this week’s low. That would trigger the sell signal.
Despite the buy signal on the daily chart and the sell signal on the weekly chart, the Emini will probably not go far up or down before Wednesday’s 11 a.m. FOMC announcement. Therefore, the trading range trading of the past 3 days will probably continue on Monday.
See the weekly update for a discussion of the price action on the weekly candlestick chart and for what to expect going into next week.
Traders can see the end of the day bar-by-bar price action report by signing up for free at BrooksPriceAction.com. I talk about the detailed S&P Emini futures price action real-time throughout the day in the BrooksPriceAction.com trading room. We offer a 2 day free trial.
When I mention time, it is USA Pacific Standard Time (the Emini day session opens at 6:30 am PST, and closes at 1:15 pm PST). You can read background information on the intraday market reports on the Intraday Market Update page.


I believe we are having a rising wedge on daily chart?
Hi Al,
Why was the break above 71 a buy? It was a 5 bear bar microchannel. I had actually been short after that L3 wedge sell starting on bar 57.
I also bought the break above bar 49 as it was a good looking bull signal bar and a wedge with bars 7 and 33. That was also after a 5 bear bar microchannel but the main difference I’m seeing is that it was steeper with bigger bars?
If you bought above bar 54, where would the stop be?
Thank you so much!