Emini waiting for Wednesday’s FOMC Fed interest rate hike
Updated 6:53 a.m.
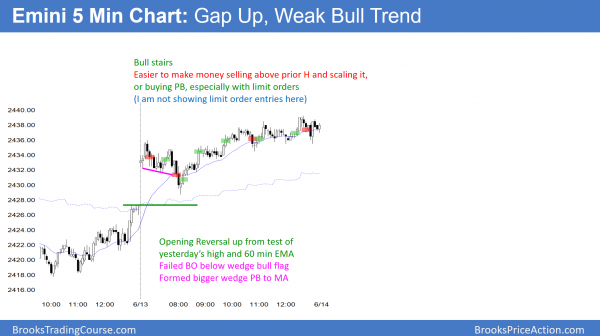
Today opened with a gap up and 3 bull bars. But, the daily chart has had 6 dojis. Furthermore, it has both a wedge top and a parabolic wedge top. The odds are against a strong bull trend day today, despite this early rally.
The bears got a 2nd failed breakout above yesterday’s high. This is a possible high of the day for a test down to yesterday’s close and the 60 minute moving average. Since the channel up from yesterday’s low is tight, the Emini might have to go mostly sideways for 5 or more bars before a swing down begins. However, at the moment, the Emini is Always In Short. In addition, the odds are against a bull trend day. The day will most likely be either a trading range day or a weak bear trend day.
Pre-Open market analysis
After Friday’s strong reversal up from a sell climax, yesterday formed a trading range day. The odds are that the Emini will remain neutral going into tomorrow’s FOMC announcement. While Friday might be the start of a 100 point correction, the bears need to create much more selling before traders will bet against this rally on the daily chart.
Since the Emini has been in a tight trading range with dojis for 6 days, the odds are that all moves up and down on the 5 minute chart will be swings lasting 1 – 3 hours instead of the start of a trend.
Overnight Emini Globex trading
The Emini is up 5 points in the Globex market. Since yesterday was a bull bar and an ioi buy signal bar, today will probably trade above yesterday’s high. At the moment, it is likely to gap up.
Yet, the daily chart has had 6 consecutive doji bars in a tight range after a parabolic wedge buy climax. In addition, the FOMC announcement comes tomorrow. Therefore, while the Emini is currently bullish on the 5 minute chart, the odds are against it rallying today to above Friday’s high. In addition, it will probably have mostly trading range price action again today, even if it rallies early.
EURUSD Forex market trading strategies
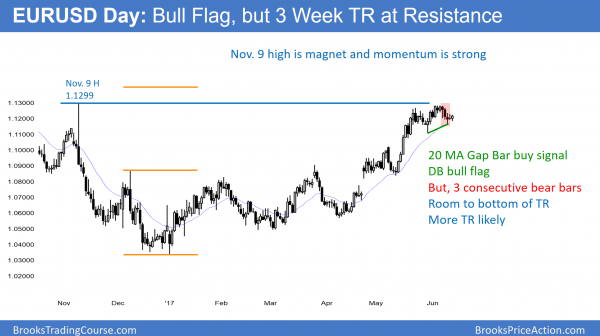
The daily EURUSD Forex chart is testing the moving average for the 1st time in more than 20 days. This is a 20 Gap Bar buy signal. Yet, it has 3 consecutive bear bars. That increases the chances that it will have a small 2nd leg down to the bottom of the 3 week trading range.
The EURUSD Forex daily chart has been sideways for 3 weeks. The bulls are finally getting to buy at an average price. Furthermore, the momentum up was strong in May. In addition, the rally is close to a very important resistance point. That is the November 9 major lower high. The odds favor at least one more test of that high.
Yet, there were 3 consecutive bear bars over the past week. That is therefore a sign that the bears are reasonably strong. It makes it likely that the 1st bounce from here will form a lower high. The bulls therefore will probably need a small double bottom with Thursday’s low before they test the November high again.
The odds favor at least one more test up. However, the 20 bar trading range and 3 bear bars mean that the bulls and bears are temporarily balanced. Consequently, there is about a 50% chance that there will be one more small leg down before the bulls buy aggressively again.
Overnight EURUSD Forex trading
The EURUSD 120 minute Forex chart is in the middle of its 3 week trading range. The bulls and bears are therefore balanced. Furthermore, the FOMC announcement tomorrow will affect all financial markets. In addition, the past 2 days were doji bars on the daily chart. Finally, the range has only been 20 pips for the past 5 hours. These factors make today likely to be another small, trading range day. Consequently, day traders will look for a few scalps again today.
Summary of today’s S&P Emini futures price action and what to expect tomorrow
The Emini gapped up, pulled back below the moving average, and then had a weak bull trend. The gapped stayed open. It spent most of the day in a tight trading range.
While today gapped up, it was mostly sideways. Furthermore, it formed the 7th day in a tight trading range. In addition, there was a wedge rally from the March 27 low. Finally, the rally from the May 18 low formed a parabolic wedge top. This is a good environment for a pullback. Yet, there is no top yet.
Tomorrow will probably be mostly sideways going into the FOMC announcement.
See the weekly update for a discussion of the price action on the weekly candlestick chart and for what to expect going into next week.
Traders can see the end of the day bar-by-bar price action report by signing up for free at BrooksPriceAction.com. I talk about the detailed S&P Emini futures price action real-time throughout the day in the BrooksPriceAction.com trading room. We offer a 2 day free trial.
When I mention time, it is USA Pacific Standard Time (the Emini day session opens at 6:30 am PST, and closes at 1:15 pm PST). You can read background information on the intraday market reports on the Intraday Market Update page.


George, here’s a link to a futures risk calculator I made some time ago in Excel. You can download it and modify it if you want. It’s more useful for swing trading strategies where risk is often wider than scalping. Maybe it’s useful? The data at the bottom of each sheet is required for the calcs and should be hidden so it’s not accidentally messed with.
Richard
https://drive.google.com/open?id=0B9CVv_VLsWn7YlFpTF9hY2MwQ1E
Thank you for the quick response Richard. Much appreciated. It will certainly be useful as I will start with swing trades as I start adding Emini to my forex markets
Hi Al,
Thank you for your great course (the new one is truly a gift to traders) which I have been studying for the past 6 years now and has assisted me to become consistently profitable. I currently just trade Forex and want to trade eMini (US500 per my broker) because my new time zone allows me to do that now. I am struggling, however, to find a suitable online tool to work out position size. There are many tools available online for forex as you know but I need to be pointed in the right direction for eMini: are you able to assist me?