Posted 6:50 a.m.
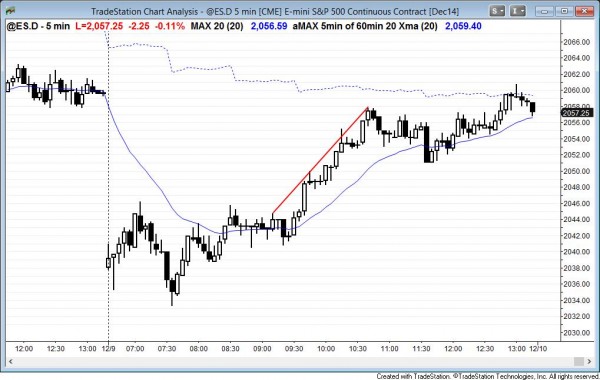
Today opened with a big gap down, creating a big island top with the November 21 gap up. Most gaps up and down have failed over recent weeks. However, the Emini is so overbought on the higher time frames that traders are aware that a correction down can happen at any time. When there is a big gap, the odds for a trend day increase.
When there is a big gap up or down, the Emini usually stays within a trading range for an hour or two until it gets closer to the moving average. At that point, it decides whether the gap will fail or succeed. Bears will look for a double top, a low 2, or a wedge bear flag on any early rally. Bulls will look for a bull reversal, which is the same as a breakout. They need 2 – 5 consecutive bull trend bars closing on their highs to convince traders that this will be a bull trend day. Until there is a strong breakout up or down, traders will be cautious and inclined to take quick profits.
As I write, there are 4 consecutive bull bars, but the odds still favor mostly sideways for 1 – 2 hours. At that point, traders will start to look for swing trades, based on the direction of the breakout.
Day trading outlook for tomorrow’s Emini price action

The Emini gapped down and created a 3 week island top. It traded down to a new low of the day and found buyers. This higher low major trend reversal led to a rally that closed the gap below yesterday’s low.
The 60 minute higher high major trend reversal reached its goal of about 50 points down (it hit 46 points). The gap down open was a gap below the daily moving average. This was the first test of the moving average in 6 weeks and the bulls bought it all day after testing down twice in the first hour.
The Emini repeatedly tried to get back to yesterday’s close in the 2nd half of the day and failed until the final minutes when it finally got there. The rally was strong enough so that the odds favor at least some follow-through buying tomorrow. The Emini has been in a tight trading range on the daily chart for over a month, and the result has been lots of trading range price action on the 5 minute chart.
Despite the strong rally today, the selloff on the 60 minute chart over the past week was so strong that the Emini will probably have to go sideways for a day or two before deciding whether it will have a 2nd leg down on the 60 minute chart, or a test of the top of the daily trading range. Whenever traders look at a chart and can see good arguments for the bears and for the bulls, the market is probably in a trading range, and that is the case here. It clearly is on the daily chart, and it probably will go sideways on the 60 minute chart for a couple of days as well. Big down, big up means big confusion, and the result is usually sideways.
Premarket price action analysis
See yesterday’s intraday market update report for today’s premarket analysis. Once there, scroll down to the heading, Day trading outlook for tomorrow’s Emini price action.
See the weekly update for a discussion of the weekly chart and for what to expect going into next week.
Traders can see the end of the day bar-by-bar price action report by signing up for free at BrooksPriceAction.com. I talk about the detailed Emini price action real-time throughout the day in the BrooksPriceAction.com trading room, and a 2 day free trial is available.
When I mention time, it is USA Pacific Standard Time (the Emini day session opens at 6:30 am PST, and closes at 1:15 pm PST). You can read background information on the intraday market reports on the Intraday Market Update page.

