Emini Trump rally awaiting tax cut vote
Updated 6:41 a.m.
The Emini opened with a doji in the middle of yesterday’s trading range. Yet, the odds favor a breakout below yesterday’s low, but buyers below. If the bears get a big breakout and follow-through, today could become a strong bear trend day. That is unlikely. Yesterday was a small day. Consequently, if today reverses up from below yesterday’s low, it could go above yesterday’s high. That would create an outside day. However, the reversal up would probably be weak.
The odds at the moment are against a strong trend day up or down. This is a quiet open in the middle of yesterday, and yesterday was a small trading range day. Unless there is a strong breakout up or down, today will probably continue yesterday’s range.
Pre-Open market analysis
The Emini did not react much to the FOMC rate hike yesterday. While it had a small bear body on the daily chart, it was another mostly sideways day. The current leg up has had 5 consecutive bull bars. Since this is a sign of strong bulls, there will probably be buyers below yesterday’s low. The bears will therefore probably need at least a micro double top before they can get a swing down.
The Trump tax cut bill is close to finalized. While the odds favor its passage next week, that is not certain. Furthermore, no one knows if traders will aggressively take profits before year-end.
Because of the extreme buy climaxes on the daily, weekly, and monthly charts, there is an increased chance of a 5% selloff beginning any time. However, traders want to see at least 2 consecutive big bear days before they believe it is underway. Without that, the bulls will keep buying every reversal down.
Overnight Emini Globex trading
The Emini is up 1 point in the Globex session. Yesterday was a sell signal bar on the daily chart and today’s open will probably not be far above yesterday’s low. This means that the odds are that today will trade below yesterday’s low to trigger the sell signal. Yet, the daily chart had 5 consecutive bull bars. Consequently, the odds are that there will be buyers below yesterday’s low. This makes a big bear trend day unlikely.
The rally has been weakening over the past few days, and it is extreme. Hence, it is climactic. This makes a big bull trend day unlikely as well. Therefore, today will probably be mostly sideways again.
Yesterday’s setups
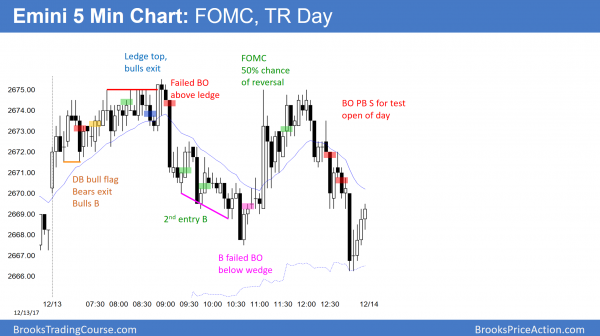
Here are several reasonable stop entry setups from yesterday. I sometimes also show limit order entries and entries on the close of bars.
EURUSD Forex market trading strategies
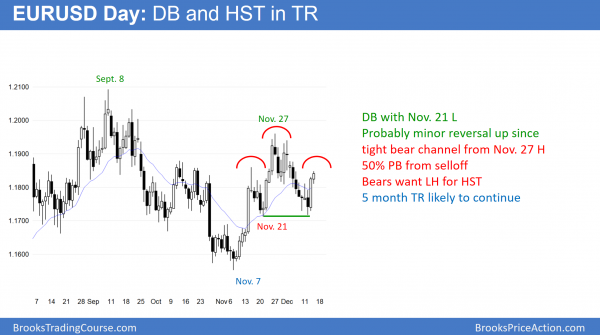
The EURUSD daily Forex chart retraced 50% of the 3 week selloff. The bears want a reversal down over the next few days for a head and shoulders top. The bulls want a pullback from yesterday’s bull breakout, and then a test of the November high.
Yesterday was a strong bull trend day on the EURUSD daily Forex chart. The bulls rallied from a double bottom with the November 21 low. However, trading ranges resist change. Furthermore, they always have both a good buy setup and a good sell setup. This rally retraced 50% of the 3 week selloff. If it stalls here, it will be the right shoulder of a head and shoulders top.
Since the 3 week selloff was in a tight channel, the rally will probably stall today or tomorrow. The bears will see the pullback as a reversal of yesterday’s rally and the start of a selloff from the right shoulder. The bulls will see the 1 – 3 day selloff as a pullback from yesterday’s bull breakout.
Since the daily chart has been in a tight trading range for a month inside a 2 year range, the odds are that the trading range will continue. This means that both the bulls and bears will probably be disappointed.
The weekly chart is still bullish. The odds are that it will continue sideways. This means that a reversal down will probably bounce at the November low. However, the November high is at major resistance on the monthly chart. Consequently, there is no sign that the 5 month trading range is about to breakout up or down any time soon.
Overnight EURUSD Forex trading
The EURUSD 5 minute chart continued yesterday’s rally overnight. It is now at around a 50% pullback from the 3 week selloff. This is a sell zone. The bulls will take profits and bear scalpers will begin to sell. The chart has been sideways in a 50 pip range overnight. The odds are that it will stall today and day traders will mostly scalp.
Yesterday’s rally was strong enough so that a big reversal down today is unlikely. More likely, the 5 minute chart will enter a 100 pip trading range for a few days. Then, the bulls will try to resume yesterday’s rally and the bears will try to create a lower high on the daily chart.
Summary of today’s S&P Emini futures price action and what to expect tomorrow
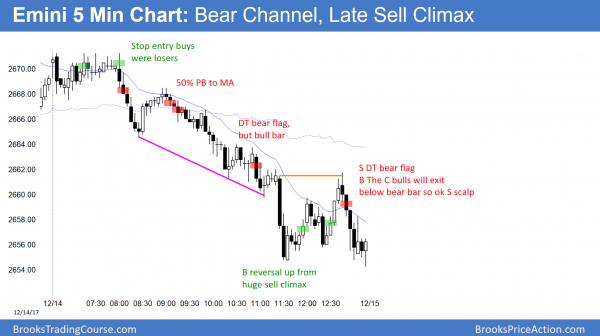
Today sold off in a tight bear channel. There was an extreme sell climax at the end of the day. The bears sold again on a test of the sell climax high.
Today triggered a sell signal on the daily chart. But, the leg up on the daily chart had 5 consecutive bull bars. This reduces the odds of a correction. Yet, there might be year-end profit taking. In addition, traders might take profits around the tax reform vote. The bears need 2 – 3 big bear bars on the daily chart before traders will conclude that they have begun a swing down.
If the Emini gaps down tomorrow, it will form an island top with last week’s gap up.
See the weekly update for a discussion of the price action on the weekly candlestick chart and for what to expect going into next week.
Traders can see the end of the day bar-by-bar price action report by signing up for free at BrooksPriceAction.com. I talk about the detailed S&P Emini futures price action real-time throughout the day in the BrooksPriceAction.com trading room. We offer a 2 day free trial.
When I mention time, it is USA Pacific Standard Time (the Emini day session opens at 6:30 am PST, and closes at 1:15 pm PST). You can read background information on the intraday market reports on the Intraday Market Update page.


