Trading Update: Thursday March 23, 2023
S&P Emini pre-open market analysis
Emini daily chart
- The Emini reversed down after yesterday’s FOMC announcement. Yesterday’s bar is a surprise outside down bar, which means traders will expect a second leg down after any pullback.
- I have been saying for some time that there are trapped bulls who bought the March 6th low. While many of those bulls likely got out for a loss on the following bar (March 7th), plenty of bulls would be willing to scale in lower.
- Yesterday tells traders that the bulls were so disappointed that they began selling out of longs several points below the March 6th low. The bears knew the bulls got trapped at the March 6th low, so they began establishing short positions at this price level.
- Yesterday’s bear reversal bar is a big enough surprise bar that it will likely have at least a small 2nd leg down. However, the bar is big, so there could be a deep pullback before the bar has a second leg down.
- Yesterday’s outside down bar is probably enough to flip the market back to Always In Short, based on the size of the bar.
- The bulls want to reverse yesterday’s outside down bar. They bulls need to get a strong reversal bar today. Next, they will need two to three consecutive bulls bars to flip the market back to Always In Long. The market will likely have at least a small 2nd leg down.
- Overall, yesterday’s bar will likely have a second leg down. However, the size of the bar increases the risk of today being a bull bar and disappointing the bears before the market gets a second leg down.
Emini 5-minute chart and what to expect today
- Emini is up 16 points in the overnight Globex session.
- The Emini rallied during the overnight Globex session and is now developing a trading range with the overnight range.
- The best the bulls can expect is a trading range and bear flag. Traders will look to sell pullbacks of yesterday’s big selloff (see above).
- Traders should expect a trading range open today and a limit order market for the first 6-12 bars.
- Yesterday’s FOMC selloff was climactic. There is a 75% chance of a trading range lasting two hours and beginning before the end of the 2nd hour. There is a 50% chance of a brief selloff on the open, followed by two hours of trading range price action.
- Because of how climactic yesterday was, traders should expect the downside to be limited today. This increases the risk of an early low of the day.
- If the market gets a selloff on the open, begins to go sideways, and develops buying pressure, traders will look for an early low.
- As always, traders should expect a trading range until sufficient evidence of trending behavior exists.
- Lastly, traders can consider waiting for a swing trade that usually forms before the end of the 2nd hour after forming a double top/bottom or a wedge top/bottom.
Emini intraday market update
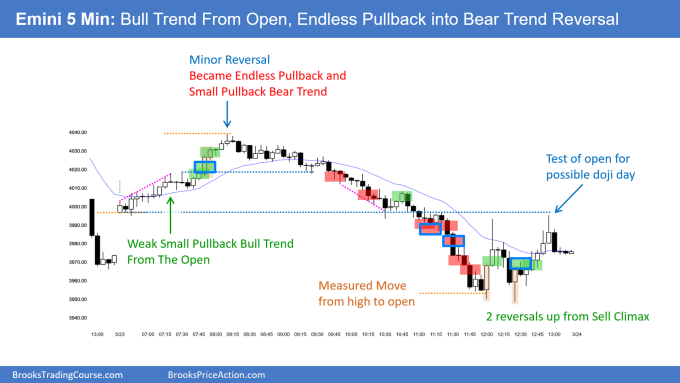
- The Emini gapped up and rallied from a trend from the open since bar 1.
- At the time of writing this (7:50 AM), the market is Always In Long.
- The market will probably go sideways soon for several hours and decide on trend resumption or trend reversal in the session’s final hours.
- The bulls want to undo the damage caused by the bears. However, the bulls will likely be disappointed today and the day will probably not close on its high.
- Since today is a trend from the open, there is a 60% chance the day will become a trading range. There is only a 20% chance the trend from the open will last all day.
Yesterday’s Emini setups

Al created the SP500 Emini charts.
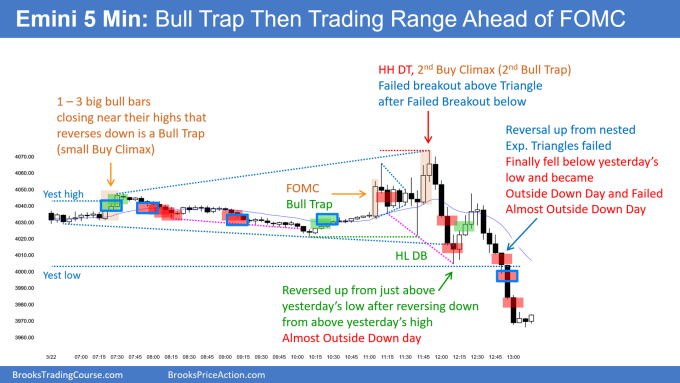
Here are several reasonable stop entry setups from yesterday. I show each buy entry with a green rectangle and each sell entry with a red rectangle. Buyers of both the Brooks Trading Course and Encyclopedia of Chart Patterns have access to a near 4-year library of more detailed explanations of swing trade setups (see Online Course/BTC Daily Setups). Encyclopedia members get current daily charts added to Encyclopedia.
My goal with these charts is to present an Always In perspective. If a trader was trying to be Always In or nearly Always In a position all day, and he was not currently in the market, these entries would be logical times for him to enter. These therefore are swing entries.
It is important to understand that most swing setups do not lead to swing trades. As soon as traders are disappointed, many exit. Those who exit prefer to get out with a small profit (scalp), but often have to exit with a small loss.
If the risk is too big for your account, you should wait for trades with less risk or trade an alternative market like the Micro Emini.
EURUSD Forex market trading strategies
EURUSD Forex daily chart

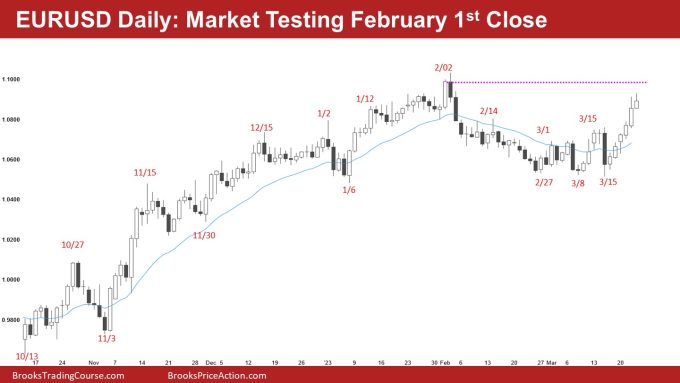
- The EURUSD is Always In Long and currently testing the February 1st close.
- The bears are hopeful that they will be able to form a lower high major trend reversal. However, the rally up from the March 15th low is strong enough that the first reversal down will probably fail.
- This means the bears will likely need to develop more selling pressure before they get any major trend reversal.
- While the rally is strong, it is testing important resistance levels, such as the February 2nd stop entry short low, and is getting near the February 1st close. This will increase the odds of sideways trading soon.
- Yesterday was a climactic bar, increasing the odds of sideways today. The market may sell off to around 50% of yesterday’s range. Even if the market does sell off today, traders need to remember that the market is in a bull trend on the daily chart, which will limit the downside.
- Overall, the market will probably reach the February 2nd close in the next few days.
Summary of today’s S&P Emini futures price action

Al created the SP500 Emini charts.
Market open video review — Al Brooks
See the weekly update for a discussion of the price action on the weekly chart and for what to expect going into next week.
Trading Room
Al Brooks and other presenters talk about the detailed Emini price action real-time each day in the BrooksPriceAction.com trading room days. We offer a 2 day free trial.
Charts use Pacific Time
When times are mentioned, it is USA Pacific Time. The Emini day session charts begin at 6:30 am PT and end at 1:15 pm PT which is 15 minutes after the NYSE closes. You can read background information on the market reports on the Market Update page.


Emini Bulls Want Measured Move Up to 4,150 – probably not in the picture in the near term .
That is correct. I talked about how the Bulls wanted an upside breakout above March 16th. However, Yesterday was too much damage to the bull case.
The bulls who bought the March 6th low used yesterday’s rally to exit longs. There were just too many sellers during yesterday’s rally.
The bulls even used the rally today to sell out of any remaining longs with a smaller loss, and the bears started to sell aggressively.
It will be interesting to see what kind of second leg down the daily chart gets.