Trading Update: Friday February 2, 2024
S&P Emini pre-open market analysis
Emini daily chart
- The Emini triggered a High 1 buy setup by going above the January 31st bear breakout bar. High 1 buy setups, especially late in a trend, often lead to sideways trading.
- While January 31st was a surprise and likely to get a second leg down, the rally’s first downside breakout began back on January 17th. This increased the odds of more buyers below.
- The bears needed to get follow-through selling below the moving average following the January 31st breakout, and they failed.
- While yesterday was a surprisingly strong rally; it is forcing traders to buy high at the top of a tight trading range. This will limit the number of traders willing to buy above yesterday’s high.
- There are probably sellers above the January 31st high, and the odds favor those bears being able to make a scalp.
- The odds are against today forming another strong bull breakout bar. This means that today will probably disappoint the bulls by forming a bad follow-through bar.
- The bears who sold the close of the January 31st bear breakout are disappointed by yesterday’s rally. This increases the odds that those bears will likely exit on any pullback or retest of the January 31st close.
- Overall, traders should expect more sideways trading as both the bulls and bears fight for a second leg in their direction.
Emini 5-minute chart and what to expect today
- Emini is down 20 points in the overnight Globex session.
- The overnight Globex market went sideways for most of the overnight session.
- The bears ended up getting a strong downside breakout during the 8:30 AM EST report.
- The downside breakout is enough of a surprise that it will likely get a second leg down and influence the open of the U.S. Session.
- Traders should be prepared for the open to have a lot of sideways trading. Most traders should consider not trading for the first 6 – 12 bars, unless they are comfortable trading with limit orders and making quick decisions.
- Most traders should focus on catching the opening swing that often begins before the end of the second hour, after the formation of a double top/bottom or a wedge top/bottom.
- The benefit to trying to catch the opening swing is that one can wait for a credible stop entry based on one of the above mentioned patterns. It also often leads to two legs and lasts two hours, which provides a great risk-reward opportunity with decent probability.
- Today is Friday, so weekly support and resistance is import. Traders should be mindful of a possible surprise breakout late in the day as traders decide to close the weekly chart.
Yesterday’s Emini setups

Al created the SP500 Emini charts.
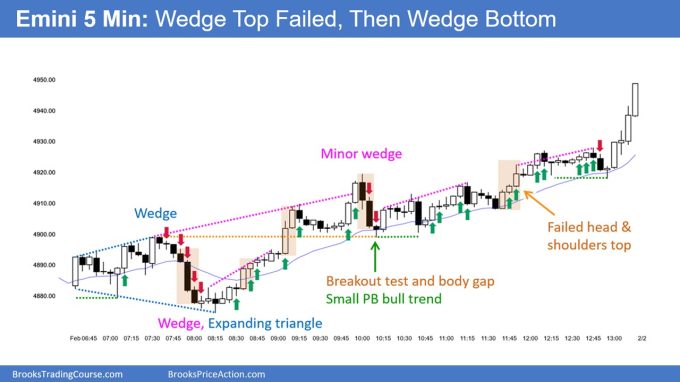
Here are reasonable stop entry setups from yesterday. I show each buy entry bar with a green arrow and each sell entry bar with a red arrow. Buyers of both the Brooks Trading Course and Encyclopedia of Chart Patterns have access to a near 4-year library of more detailed explanations of swing trade setups (see Online Course/BTC Daily Setups). Encyclopedia members get current daily charts added to Encyclopedia.
My goal with these charts is to present an Always In perspective. If a trader was trying to be Always In or nearly Always In a position all day, and he was not currently in the market, these entries would be logical times for him to enter. These therefore are swing entries.
It is important to understand that most swing setups do not lead to swing trades. As soon as traders are disappointed, many exit. Those who exit prefer to get out with a small profit (scalp), but often have to exit with a small loss.
If the risk is too big for your account, you should wait for trades with less risk or trade an alternative market like the Micro Emini.
EURUSD Forex market trading strategies
EURUSD Forex daily chart
- The EURUSD formed a strong reversal yesterday, closing at the moving average instead of far above it.
- The bulls tried to get follow-through buying today. However, they failed, and the bear ended up overwhelming the bulls and getting a reversal down.
- Because of yesterday’s strong bull reversal bar, there are probably buyers below its low.
- The bears want to trap the bulls into a bad long and force them to sell out of longs for a loss. This would likely drive the market down to the December low.
- More likely, the EURUSD is going to continue to go sideways to up, and the bears will soon get disappointed.
- Overall, traders will pay close attention to today’s bar to see how determined the bears are to get a strong close on its low.
Summary of today’s S&P Emini price action

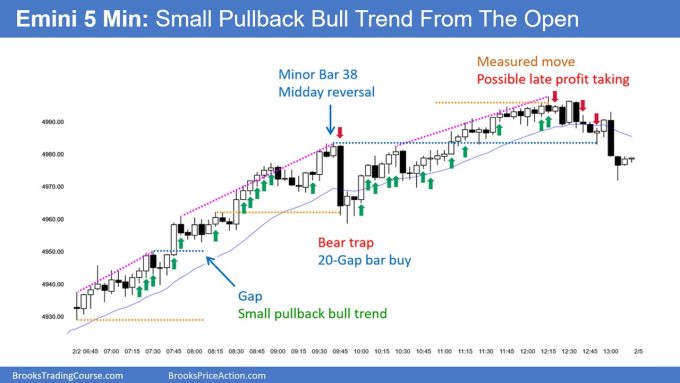
Al created the SP500 Emini charts.
End of day video review
End Of Day Review will be presented in the Trading Room today. See below for details on how to sign up.
See the weekly update for a discussion of the price action on the weekly chart and for what to expect going into next week.
Trading Room
Al Brooks and other presenters talk about the detailed Emini price action real-time each day in the BrooksPriceAction.com trading room days. We offer a 2 day free trial.
Charts use Pacific Time
When times are mentioned, it is USA Pacific Time. The Emini day session charts begin at 6:30 am PT and end at 1:15 pm PT which is 15 minutes after the NYSE closes. You can read background information on the market reports on the Market Update page.


Aren’t sellers above 1/12 trapped by the gap?
If they scaled in then they MIGHT have had a chance to get out on the 31st with a small loss but overall I agree.