Trading Update: Tuesday April 5, 2022
Emini pre-open market analysis
Emini daily chart
- The bulls were able to get a strong bull close yesterday, which reversed most of the March 31 bear bar. Bears want second failed breakout.
- Yesterday increases the odds that the market will go at least a little bit higher.
- The bulls are hopeful they can get another strong bull close today; however, more likely, the bulls will be disappointed.
- The bulls are trying again to break above the February high (4577.5). The bulls will probably fail. However, the market is in a trading range, and there are magnets above, such as the November 2021 – December 2021 trading range midpoint (4,668), and the market may have to reach this.
- Traders will pay close attention to see if today will be another strong bull bar or if the bears will be able to disappoint the bulls by getting a bear close today (more likely).
- The bears hope today will close on its low, setting up a second failed breakout of the February high, increasing the chances of a selloff back to 4,400 round number and the March 3 high.
- Overall, the rally up to March 29 was parabolic and climactic, which means two legs down are likely. If March 31 was the first leg down, traders would expect a second leg down, which means yesterday’s bull bar may just be a pullback that will lead to a second leg down, possibly testing 4,500 big round number.
Emini 5-minute chart and what to expect today
- Emini is down 8 points in the overnight Globex session.
- The market went sideways for most of the overnight session and had a strong climactic rally around 12:00 AM PT.
- The bull breakout failed, and the market got sucked back into the sideways trading that happened before the bull breakout (final flag). Since 12:00 AM PT, the market has been always in short and in a tight bear channel.
- The bears hope this will lead to more bear trending price action in the U.S. day session.
- Overall, traders should be open to the possibility of a trend from the open in either direction. However, traders should expect sideways trading.
- As always, traders should wait for a strong breakout with follow-through clearly breaking out of support or resistance. Otherwise, traders should wait for a credible stop entry, such as a double bottom/top or a wedge bottom/top.
- On the open, there will often be a lot of failed breakouts and fast-moving bars. This can cause traders to get trapped in the wrong direction and take a big loss early in the day, making it difficult to recover from it.
- If one has difficulty in the open, one thing to consider is waiting for 6-12 bars before doing anything. While you will occasionally miss trends from the open moves, it will keep one from getting whipsawed by reversing back and forth.
Yesterday’s Emini setups

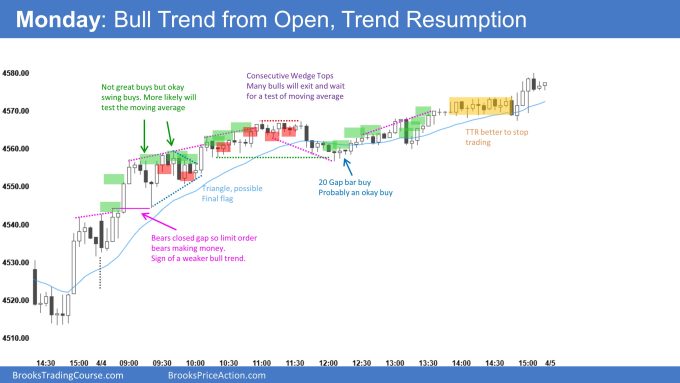
Emini charts created by Brad. Al will be back on April 11, 2022
EURUSD Forex market trading strategies
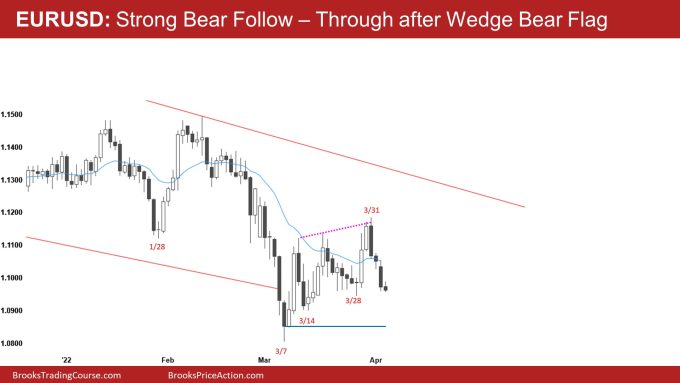
EURUSD Forex daily chart

- The EURUSD has three consecutive bear bars, with two closing near their lows.
- The market is probably back to Always in Short. The bears hope that these three bear bars are strong enough that the market will have a second leg down, which is likely since it is also a wedge bear flag.
- The market is at the March 29 low, where some bulls will buy; however, after three consecutive bear bars, most bulls will not be all that eager to buy until there is a second leg down.
- The bears hope they have enough momentum now to get a downside breakout and reach the low close in March or even break below March.
- Overall, the bears need to get more follow-through, further convincing traders that the market is going lower.
- Right now, the bears have a shot at getting a bear breakout to the downside and testing the lows of March. The market is in a trading range, though, which means that there is a greater risk of the bears getting disappointed.
- The bears could become disappointed if the bulls have a strong bull close today and after the market has a second leg down testing the lower 1/3 of March. This would make traders more hesitant to sell at the bottom of the March range.
Summary of today’s S&P Emini futures price action and what to expect tomorrow

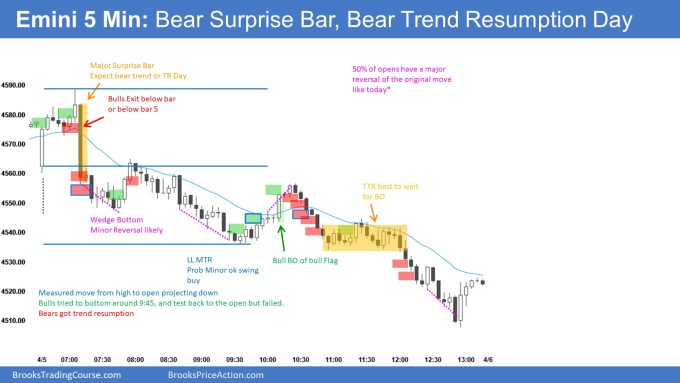
Emini charts created by Brad. Al will be back on April 11, 2022
End of day summary
- The market opened with a gap down, and the rally tested yesterday’s high. The rally was in the form of two legs.
- The bears got a huge bear bar around 7:10 PT. This bear bar was a surprise and big enough to lead to a swing down for several hours.
- Because of the size of the bear bar the market went the market only went down for two small legs around 7:40 PT before reversing up to the moving average of 7:55 PT.
- Although the rally up to 7:55 PT was strong, it was not as strong as the self-off that happened 9 bars ago at 7:10 PT. Often when you get a huge breakout bar, the market will have a deep pullback soon after the breakout, as it did on the rally at 7:55 PT.
- The bulls tried to get a higher low major trend reversal at 8:30 PT but failed, and the bears got a bear channel down to 9:30 PT.
- The selloff to 9:30 PT was climactic with several consecutive sell climaxes, so the odds favored a bounce up. The channel down to 9:30 PT was tight, so the odds were any bounce would be minor, and the market would have to go sideways.
- The bulls ended up breaking above the moving average at 10:00 PT. However, the rally was a parabolic wedge that led to a selloff back down to the lows around 9:30 PT.
- The market tried to form a higher low major trend reversal around 11:45 PT, but the signal bar was big and in the upper portion of a tight trading range. The signal bar was also right below the moving average, which is not a great area to buy.
- The 11:45 PT higher low significant trend reversal failed and led to a two-legged selloff.
- Today was a great reminder of the importance of waiting for a decisive trendline break and retest when you have a tight channel.
- Also, most major trend reversals are minor and not major. This means that most major trend reversals go sideways, so it is important to expect that going into those trades.
- Lastly, when the market is forming lower highs and lower lows, it is trending and can trend down for a long time like it did today.
See the weekly update for a discussion of the price action on the weekly chart and for what to expect going into next week.
Trading Room
Traders can see the end of the day bar-by-bar price action report by signing up for free at BrooksPriceAction.com. I talk about the detailed S&P Emini futures price action real-time throughout the day in the BrooksPriceAction.com on trading room days. We offer a 2 day free trial.
Charts use Pacific Time
When I mention time, it is USA Pacific Time. The Emini day session charts begin at 6:30 am PT and end at 1:15 pm PT which is 15 minutes after the NYSE closes. You can read background information on the market reports on the Market Update page.


Hello, is there a typo on your chart? why would bears exit below bar 5 or the big climactic bear bar, shouldn’t we expect more continuation from that bar since it is a surprise bar? Could you elaborate more why bears exit? thank you
Yes, that was a typo. I meant to say bulls exit below bar 5 or a couple of points below bar 7
Hi, Brad
I saw you marked Bar18 and Bar 47 as signal bars, both bar15~17 and bar 40~46 are fairly tight, the major reason of using first bear bar as signal is major surprise bar 8?
especially bar 40~46, second leg up seems reasonable.
Thanks
Bar 18 was the first moving average test since the major surprise bar 8. While it is not all that clear to go short here, many bulls would exit below and wait for an upside breakout of the moving average. Also, bar 18 should lead to a trading range or bear trend after bar 8. Again the main reason for marking bar 8 is to show that bulls exit here; aggressive bears go short.
Bar 47 is a parabolic wedge and a micro double bottom with bar 45. Bulls exit below the bar, which means aggressive bears sell below. While the channel is tight, it is a reasonable short betting on a parabolic wedge and two legs down. Nobody knew we would get six consecutive bears bars following the wedge, but that happens sometimes.
Hello Brad, I read the comments and let a lot from other traders’ questions and answers posted, would it be possible to add some partial — may be top of the hour bar numbers for milestones on the chart so counting would be easy when bar numbers are mentioned, such as marking B712, B36, B42 so on. I had to count to see by bar 47 was micro DB with bar 45 doji twice and I still can’t see the DB you mentioned to MAT XC thank you.
I revised parabolic wedge charts, I missed this point. with micro DT, it is reasonable for TBTL.
really appreciate your help.
Your tip to wait 6-12 bars on the open would have been very useful today if i listened. Thanks Brad!