Trading Update: Tuesday March 1, 2022
Emini pre-open market analysis
Emini daily chart
- The bulls were able to get a third consecutive bull close on the daily chart. A strong reversal up after wedge bottom.
- The prior blog post states that traders do not know two things.
- First: Will this be the low for the next several months, or will the market have to fall below February and form another bottom before reversing up.
- Second: Will the market form a trend and reach the all-time high, or will the market enter a trading range and go sideways for the next couple of months and possibly the rest of the year.
- The market came within 108 points, reaching 4,000, the big round number. Some traders will question if that was an appropriate test of 4,000 or if the market will have to reach it. That big round number is an obvious target; also, it is close to a 20% correction. There is a real possibility that the market will fall below February and reach 4,000 and the 20% correction price level of 3,846.
- There is about a 30% chance the bears get a bear breakout below February that reaches the pre-pandemic highs around 3,100.
- The bulls see a wedge bottom with December 3 and 24 and are hopeful this will lead to two legs up.
- The bears will want to get a bear breakout below a wedge bottom and a measured move down, which is unlikely.
- The market will likely begin to go sideways soon as the bears try to form a lower high and the bull tries for trend resumption.
- While the three consecutive bull bars are good for the bulls, they need to convince traders that the bull trend has resumed.
- Traders will pay attention to see if the bull can get a 4th consecutive bull bar today, which would increase the buying pressure, and the odds of the trend resumption. Or will the bulls be disappointed with a bear bar, reminding traders that the market is in a likely trading range.
Emini 5-minute chart and what to expect today
- Emini is down 16 points in the overnight Globex session.
- The bulls had a rally into the close during the day session, and overnight the bulls got a second leg up.
- There was an exhaustive buy climax around 11:15 pm PST yesterday that led to a bear trend for about five and a half hours.
- Since today is likely to gap down, traders will expect the market to go sideways to the moving average as traders decide if the gap will lead to a bear trend day or if the market will reverse up following the gap down.
- Traders will look for likely patterns on the open such as a wedge bottom or double bottom, or a wedge top, or double top.
- Traders should expect a limit order market and wait for a credible buy or sell setup such as a stop entry or breakout with follow-through.
Yesterday’s Emini setups

Al created the SP500 Emini charts.
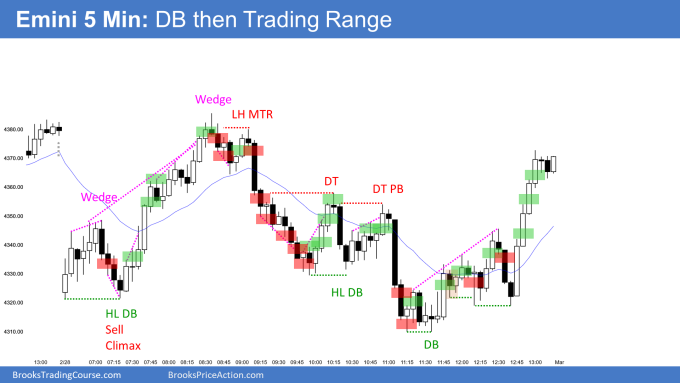
Here are several reasonable stop entry setups from yesterday. I show each buy entry with a green rectangle and each sell entry with a red rectangle. Buyers of both the Brooks Trading Course and Encyclopedia of Chart Patterns have access to a much more detailed explanation of the swing trades for each day (see Online Course/BTC Daily Setups).
My goal with these charts is to present an Always In perspective. If a trader was trying to be Always In or nearly Always In a position all day, and he was not currently in the market, these entries would be logical times for him to enter. These therefore are swing entries.
It is important to understand that most swing setups do not lead to swing trades. As soon as traders are disappointed, many exit. Those who exit prefer to get out with a small profit (scalp), but often have to exit with a small loss.
If the risk is too big for your account, you should wait for trades with less risk or trade an alternative market like the Micro Emini.
EURUSD Forex market trading strategies
EURUSD Forex daily chart

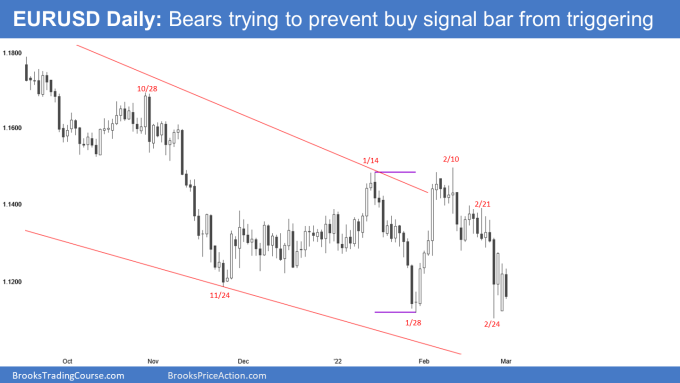
- The EURUSD is trying to form a bottom after the failed breakout last week below the January low.
- The bears are currently trying to prevent yesterday’s buy signal bar from triggering.
- The odds are that the market will bounce soon and try for a test of the February highs.
- One problem for the bulls is how tight this bear channel has been since the high of February.
- While the selloff looks like a leg in a trading range and the bears have had bad follow-through, stop entries have not worked for the bulls.
- I bring up the tight channel because while it is not likely, this is a double top, and the bears are hopeful they will get the bear breakout below January and measured move down. The probability is low, but it can easily be 35-40%.
- I bring the above up because traders need to be aware of the least likely outcome: a bear breakout and measured move down.
- Remember, the market is in a trading range, which means there is a bull and bear case, and the probability of either has to be closer to 50% than it may appear. Otherwise, the market would not be in a trading range. It would be trending.
- The bulls see yesterday as an inside bar, and a stop entry buy. The bulls will want today to trigger the stop entry buy and close as a strong entry bar.
- While the odds favor a rally testing back up to the February highs, the bulls’ probability is not yet high. Bulls need consecutive strong bull bars to convince traders we are going higher, such as January 31 – February 2.
- Currently, the market is testing around 50% of yesterday’s range so that bulls may buy here. Often when you have a big signal bar, such as yesterday, traders try and buy a 50% retracement of the bar.
- Overall, the market is in a trading range, and it is low in the range, so traders will expect a bounce up soon to test back into the middle of the trading range.
Summary of today’s S&P Emini futures price action and what to expect tomorrow
- I will post chart after the close.

Al created the SP500 Emini charts.
End of day summary
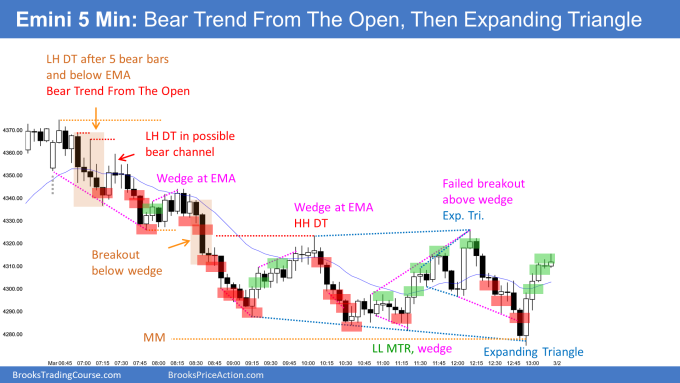
- The day gapped down and failed to rallied above yesterday’s close.
- Bar 4 set up a high 2 buy; however, it was high in the range, which lowered the probability of the H2 being successful. This led to bar 5 being an outside down bar and the bulls briefly giving up.
- Bar 8 was probably always in short. However, it was right in the middle of yesterday’s range, which is a bad area to buy or sell. Since the odds favored a second leg down, traders looked to buy a pullback, which happened on bars 12-15.
- Bar 16 tried to form a wedge bottom; however, it followed three consecutive bear bars, which increases the odds of 16 being a minor reversal.
- Bar 25 was a surprise bar, and the odds favored at least a second leg down and possibly a measured move down of the bar. Bar 26-27 was follow-through; however, the bars were small, which was a sign of more trading range price action and to be aware of a possible retest of the 25 close eventually (happened during bar 42).
- Bar 33 formed a parabolic wedge bottom with a decent signal bar on 33, leading to a test up to the 68 close.
- Overall, the day was a trend that led to an expanding triangle from the open.
- While the market was in a bear trading range for the first two hours, it looked like a bear leg in a trading range. This means that when bar 25 breaks below the range, there will be plenty of bulls who will be willing to use wide stops and scale in lower, which is why the rally to bar 42 tested back into the range of the first two hours.
- The most important thing to remember on a day like today is to be careful about buying too high and selling too low, especially after 2nd leg.
See the weekly update for a discussion of the price action on the weekly chart and for what to expect going into next week.
Trading Room
Traders can see the end of the day bar-by-bar price action report by signing up for free at BrooksPriceAction.com. I talk about the detailed S&P Emini futures price action real-time throughout the day in the BrooksPriceAction.com on trading room days. We offer a 2 day free trial.
Charts use Pacific Time
When I mention time, it is USA Pacific Time. The Emini day session charts begin at 6:30 am PT and end at 1:15 pm PT which is 15 minutes after the NYSE closes. You can read background information on the market reports on the Market Update page.


Is buying above bar 10 (bull bar) a valid entry given how the wedge was forming prior to it?
I think the channel down was fairly tight. Also, if you buy above a big bar in a TR so that your entry is in the middle third of the TR, your probability of winning is about 50%. The reward left isn’t enough to justify taking such a trade.
Yes, I agree with Abir; while you can take the trade for a swing, the math is not great with it being at the middle to the range.
Also, notice what happened on bars 12 and 13. The bulls who bought 10 were disappointed by bar 11 and used bar 12-13 to exit at breakeven.
Nice summary!