Trading Update: Friday July 14, 2023
S&P Emini pre-open market analysis
Emini daily chart
- The Emini formed another strong bull trend bar on the daily chart. While the rally that began on July 10th is becoming climactic, there is no sign of a top and the first reversal down is likely be minor and lead to a second leg up.
- This first reversal down will probably fail as any selloff is likely to be minor.
- The market will probably pull back for one to two bars as bulls begin to take partial profits.
- The bulls hope the market will get a measured move up based on the June trading range. The measured move of the June trading range projects up to around 4,600.
- The bears hope the rally will lead to a final flag with the June trading range and a reversal down. The bears need to develop more selling pressure before traders are convinced they can take control of the market.
- Overall, the rally is strong enough that the first reversal down will likely fail. The Bulls will look to buy any pullback for a second leg up. If the reverse down is deep, more traders will view the market as a trading range and look to exit around the June 13th high.
Emini 5-minute chart and what to expect today
- Emini is up 7 points in the overnight Globex session.
- The overnight Globex market went sideways for most of the overnight session after the bears sold off at the end of yesterday’s session.
- The bulls recently rallied above yesterday’s high early this morning.
- Today is Friday, so weekly support and resistance are important. The bulls want the week to close on its high, and the bears want to create a tail on the bar.
- Traders should expect the market to go sideways for the first 6 – 12 bars. Traders should consider not trading for the first 6-12 bars until there is clarity about the day’s structure. Most days form a breakout mode structure on the open, which means traders should expect a trading range.
- Most importantly, traders should never deny what the chart tells them. If the open starts to trend up with strong consecutive trend bars, traders should find a way to enter in the direction of the trend.
Yesterday’s Emini setups

Al created the SP500 Emini charts.
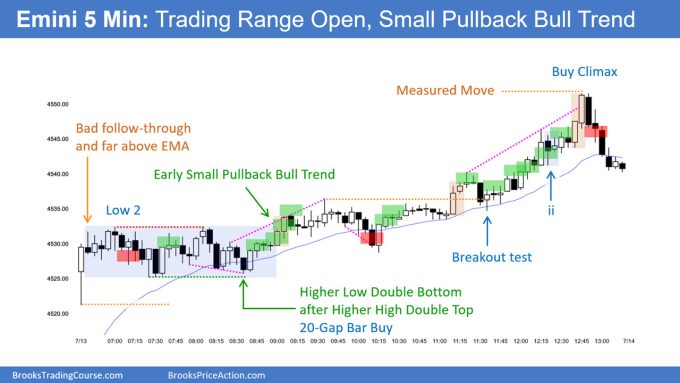
Here are several reasonable stop entry setups from yesterday. I show each buy entry with a green rectangle and each sell entry with a red rectangle. Buyers of both the Brooks Trading Course and Encyclopedia of Chart Patterns have access to a near 4-year library of more detailed explanations of swing trade setups (see Online Course/BTC Daily Setups). Encyclopedia members get current daily charts added to Encyclopedia.
My goal with these charts is to present an Always In perspective. If a trader was trying to be Always In or nearly Always In a position all day, and he was not currently in the market, these entries would be logical times for him to enter. These therefore are swing entries.
It is important to understand that most swing setups do not lead to swing trades. As soon as traders are disappointed, many exit. Those who exit prefer to get out with a small profit (scalp), but often have to exit with a small loss.
If the risk is too big for your account, you should wait for trades with less risk or trade an alternative market like the Micro Emini.
EURUSD Forex market trading strategies
EURUSD Forex daily chart

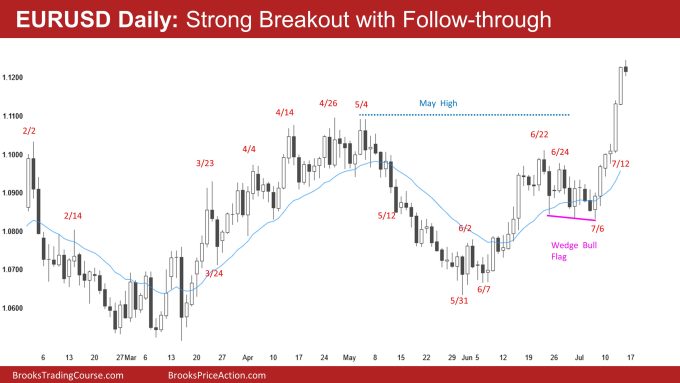
- The EURUSD formed a strong bull breakout with follow-through yesterday, closing far above the May high.
- While the rally that began on May 6th is climactic, it is strong enough that the first reversal up will probably fail.
- The risk is getting large for the bulls. This means that bulls will take partial profits on longs and increase the odds of the market getting pullback.
- The downside is probably limited, and the best the bears can probably get is one to two legs sideways.
- The bears hope to get a strong downside breakout that disappoints the bulls. The bulls will likely buy the first reversal down, and the market will get a second leg up.
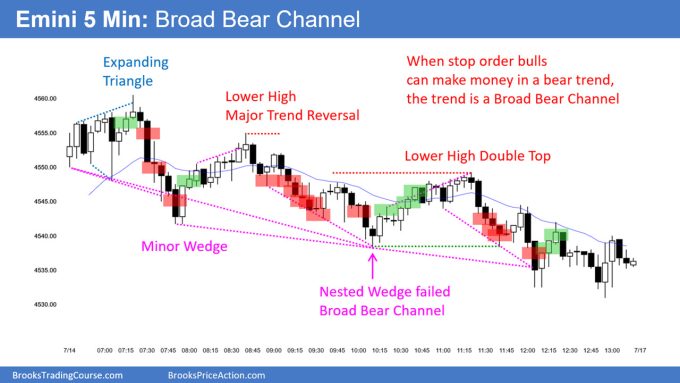
Summary of today’s S&P Emini price action

Al created the SP500 Emini charts.
End of day video review
Here is YouTube link if video popup blocked:
Emini End of Day Video Review for Friday July 14 2023 – Brad Wolff
See the weekly update for a discussion of the price action on the weekly chart and for what to expect going into next week.
Trading Room
Al Brooks and other presenters talk about the detailed Emini price action real-time each day in the BrooksPriceAction.com trading room days. We offer a 2 day free trial.
Charts use Pacific Time
When times are mentioned, it is USA Pacific Time. The Emini day session charts begin at 6:30 am PT and end at 1:15 pm PT which is 15 minutes after the NYSE closes. You can read background information on the market reports on the Market Update page.


Thanks for these daily blog posts. Very helpful.
I really appreciate them too. I write my own blog post in OneNote every morning and then compare it to Brad’s. He adds some good points. Writing a daily blog post forces traders to think and get ready for the day.
That’s a great idea. Thanks for sharing.