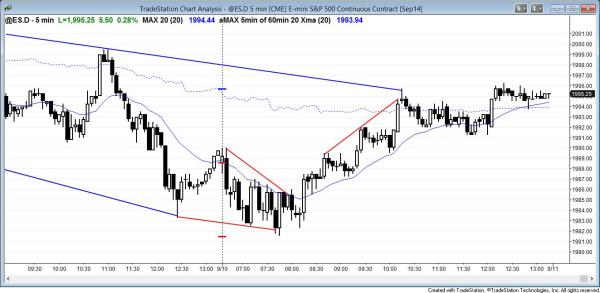
The Emini reversed up from below yesterday’s low. It stalled at a measured move up from the low to the open of the day, and at the bear trend line, and the 60 minute moving average, but then rallied into the close.
End of day comments about today’s Emini price action and day trading
The Emini had a trading range open and a bull breakout, but the rally had bad follow through after each breakout. The Emini reversed up from the daily moving average and down from the 60 minute moving average. The rally had three pushes up and found sellers at the 60 minute moving average, the bear trend line, and the measured move projection from the low to the open of the day. This made the open of the day a magnet in the last hour. The bears wanted to test the open of the day and turn the bull trend day into a trading range day, and the bulls wanted the day to close on its high. There was a brief bear breakout, but it reversed up and the Emini rallied to a new high. The bulls wanted a strong breakout above the 60 minute moving average. Although they got the breakout, it was not big and the follow through was weak. However, the day closed on its high, awaiting the president’s speech tonight. The Emini is in the middle of its 3 week trading range.
Yesterday triggered a 60 minute lower high major trend reversal sell when the Emini fell below the bottom of the trading range. It also triggered a failed bull breakout on the weekly chart yesterday when the Emini traded below last week’s low. However, the breakout and follow-through were weak and the bear breakout might fail, just like all prior breakout attempts up and down in this 3 week trading range on the 60 minute chart.
S&P500 Emini intraday market update for price action day traders
Time of update 8:03 a.m. PST.
The Emini began with a trading range open type of price action for day traders and entered breakout mode. It had strong bull and bear trend bars with bad follow-through. The Emini tested yesterday’s low. The bulls wanted an early low of the day. The bears wanted follow-through selling after yesterday’s breakout below the 60 minute neckline of the lower high major trend reversal.
Both sides are looking for a breakout and measured move. Once a breakout with follow-through occurs, there probably will be more follow-through for at least a couple of hours and possibly the rest of the day. There are many big bull trend bars around yesterday’s low and this is a sign of buying pressure. However, until there is a breakout, the breakout can go in either direction.
S&P500 Emini 60 minute, daily, weekly, and monthly candle charts
The lower high major trend reversal (head and shoulders top) triggered on the selloff at the end of yesterday, but the Emini had weak follow-through, as expected on a trading range day. Most tops develop within trading ranges, and most breakouts from trading ranges fail. This is an example of that, at least at the moment.
The breakout was small and lasted only one bar on the 60 minute chart. However, the reversal up might prove to be simply a pullback from that breakout, and a much stronger breakout might soon follow. Until I see it, I will assume that the trading range will last forever and that all breakouts up and down will fail. Remember, the 60 minute chart had several breakouts above the trading range during the first two weeks of the range, and each one failed. Now, it is trying downside breakouts.
The Emini is choosing between trend resumption up and trend reversal down, and neither side has yet proven that it is in control. Day trading institutions keep buying low, selling high, and scalping, and that behavior is what creates trading range, and that is why we should trade that way until there is a clear breakout. There is no willingness yet to hold onto positions and add to them. Once that comes, one side will have won and a trend will begin.
The candle on the Emini weekly chart broke below the low of last week. This created a failed breakout above the July high. The week is not over yet so we do not know if the breakout will be big. If it is not big, we do not know if this week’s close will be below last week’s low, which would be a sign of strength for the bears. Traders will pay attention to this on Friday.
See the weekly update for a discussion of the weekly chart.
Traders can see the end of the day bar-by-bar price action report by signing up for free at BrooksPriceAction.com. I talk about the detailed Emini price action real-time throughout the day in the BrooksPriceAction.com trading room, and a 2 day free trial is available.
When I mention time, it is USA Pacific Standard Time (the Emini day session opens at 6:30 am PST, and closes at 1:15 pm PST). You can read background information on the intraday market reports on the Intraday Market Update page.

