Trading Update: Thursday August 10, 2023
S&P Emini pre-open market analysis
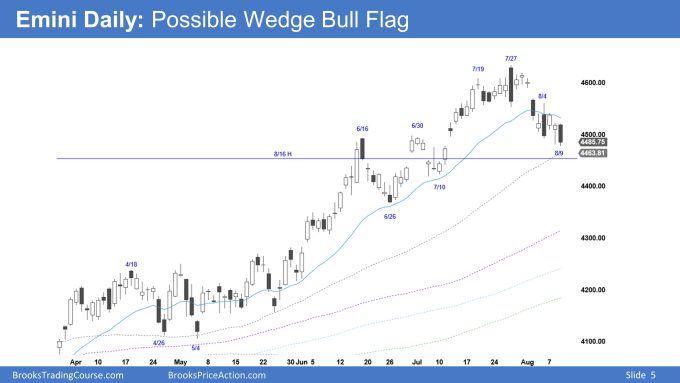
Emini daily chart

- The bulls are hopeful that the Emini is forming a wedge bull flag following the tight bull channel.
- Next, the bulls want a strong buy signal bar today, and they are hopeful that tomorrow will lead to a strong entry bar for the bulls.
- While the Bears did a good job with the selloff down to August 9th, there are problems with it. The channel down is forming a wedge (July 27th, August 4th and 9th). This will increase the odds of a two-legged rally and a possible test of the August 4th high.
- The bears did enough to increase the odds of a second leg down and transition into a trading range. However, they failed to make the market Always In Short. This means a rally from the August 9th selloff can be very deep and possibly go to a new high.
- Today is Thursday, so the weekly chart is becoming more important. The open of the week is 4,518.25 and the bulls are hopeful that they can close above open creating bad follow-through following last week’s rally.
- This means that today may form a bull inside bar with yesterday’s outside bar on the daily chart; this would cause the day to close near the open of the week going into Friday.
Emini 5-minute chart and what to expect today
- The overnight Globex Market rallied back to around the midpoint of the weekly chart.
- There are several reports at 8:30 AM EST that have the potential to move the market.
- On the open traders should be ready for anything but expect a trading range open. This means that most traders should consider not trading for the first 6-12 bars. This is because the odds favor a limit order market and a trading range open.
- if the market forms consecutive strong trend bars on the open, traders will look to enter in the direction of the breakout.
- The most important thing on the open is to be patient. It is easy to become excited to trade on the open and force trades. There are 81 bars to the day, so there is plenty of time to place trades.
Emini intraday market update
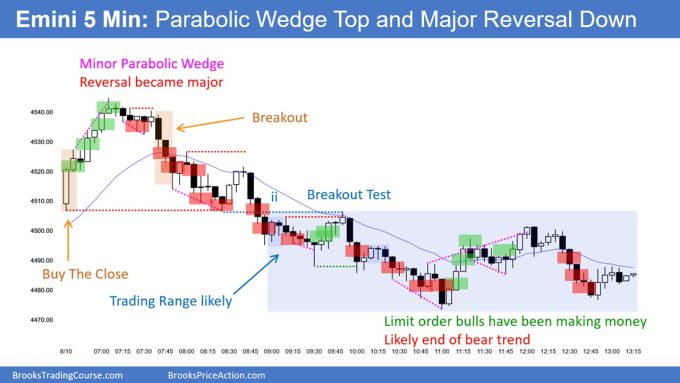
- The Emini rallied on the open for the first 7 bars of the day.
- However, the bulls formed a parabolic wedge top, and the market got a strong downside breakout with a follow-through on bar 15 (10:45 EST).
- The bears got a spike and channel below yesterday’s low on bar 54 (2:00 PM EST). However, the problem with bar 54 was that it was the best-looking breakout bar late in the bear trend. This increased the odds that bar 54 would fail and the market would get a reversal up.
- The bulls see the breakout on bars 55-57 as strong enough for a second leg up. They are hopeful that the bulls will be able to get a measured move up based on the bodies of bars 55-57.
Yesterday’s Emini setups

Al created the SP500 Emini charts.
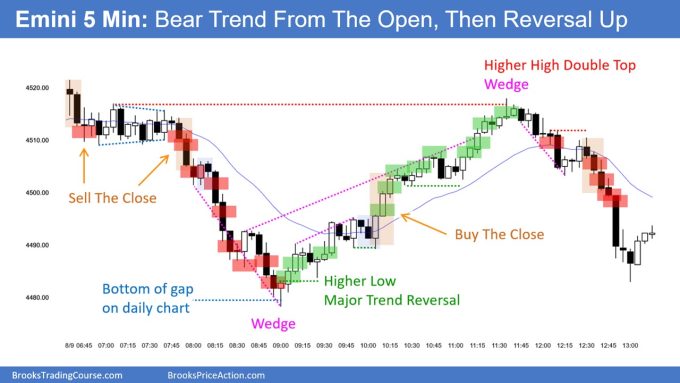
Here are several reasonable stop entry setups from yesterday. I show each buy entry with a green rectangle and each sell entry with a red rectangle. Buyers of both the Brooks Trading Course and Encyclopedia of Chart Patterns have access to a near 4-year library of more detailed explanations of swing trade setups (see Online Course/BTC Daily Setups). Encyclopedia members get current daily charts added to Encyclopedia.
My goal with these charts is to present an Always In perspective. If a trader was trying to be Always In or nearly Always In a position all day, and he was not currently in the market, these entries would be logical times for him to enter. These therefore are swing entries.
It is important to understand that most swing setups do not lead to swing trades. As soon as traders are disappointed, many exit. Those who exit prefer to get out with a small profit (scalp), but often have to exit with a small loss.
If the risk is too big for your account, you should wait for trades with less risk or trade an alternative market like the Micro Emini.
EURUSD Forex market trading strategies
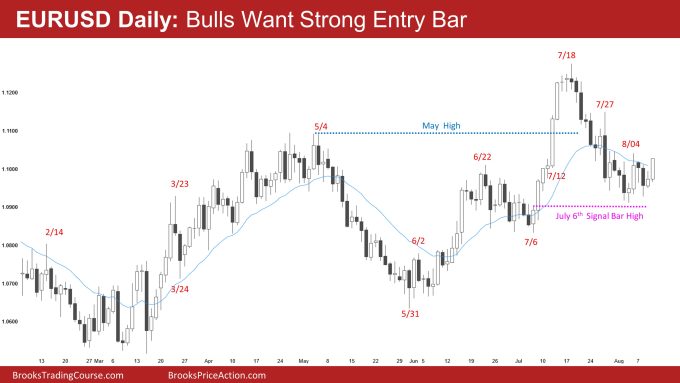
EURUSD Forex daily chart

- The EURUSD is trying to get an upside breakout and a close above the moving average after forming a higher low with the August 3rd low.
- The bulls want today to close with a strong buy signal bar, increasing the odds of higher prices and a test higher.
- The bears want to damage today’s breakout and, at a minimum, create a tail above.
- The selloff was likely a leg in a trading range, which increases the odds of sideways trading and a rally lasting a few legs.
- The bears know that the odds favor a trading range and do not mind if the market goes sideways as long as they can form a major trend reversal.
- This means that the bears may step aside for a few legs and look to sell a 50% pullback of the August selloff as long as the rally is not too strong.
- Overall, traders will expect the bears to step aside for a couple of legs, which means that sideways trading is likely over the next few weeks.
Summary of today’s S&P Emini price action

Al created the SP500 Emini charts.
End of day video review
Here is YouTube link if video popup blocked:
Emini End of Day Review – Thursday August 10, 2023 – Brad Wolff
See the weekly update for a discussion of the price action on the weekly chart and for what to expect going into next week.
Trading Room
Al Brooks and other presenters talk about the detailed Emini price action real-time each day in the BrooksPriceAction.com trading room days. We offer a 2 day free trial.
Charts use Pacific Time
When times are mentioned, it is USA Pacific Time. The Emini day session charts begin at 6:30 am PT and end at 1:15 pm PT which is 15 minutes after the NYSE closes. You can read background information on the market reports on the Market Update page.


Today after many good bull bars at the open, if you buy the close of 6 thinking Bull Trend or Trading Range and you don’t get out on 13, thinking if it’s a bull trend I’m gone swing and if it’s a trading range I’m gone buy lower above a bull bar, what do you do? When do you give up on the idea of a trading range and a retest of 6? Do you buy above 24 and take a big loss below 23? Or the trading range was already unlikely at the close of 16? Thank you.