Trading Update: Wednesday November 10, 2021
Emini pre-open market analysis
Emini daily chart
- Monday was a sell signal bar for a parabolic wedge reversal buy climax that was testing the top of the 6-month bull channel.
- Yesterday triggered the sell signal by breaking below Monday’s low. Since yesterday closed below its midpoint and below Monday’s low, and it had a big bear body, today should trade sideways to a little lower.
- Because the bull trend has been strong, this reversal down is probably minor. That means it should last only a few days before the bulls buy again.
- There are now 3 consecutive bear bars. That is enough selling to usually lead to a 2nd leg sideways to down.
- A parabolic wedge buy climax typically also has at least a small 2nd leg sideways to down.
- Consequently, even if the bulls buy again today or tomorrow, the reversal up will probably only last a day or two.
- With the bulls looking to buy the selloff and the bears looking to sell the 1st bounce, the Emini will probably be mostly sideways for a few days. With the buy climax on the daily chart being as extreme as it has been, the Emini could enter a trading range for a couple weeks.
- Yesterday is a High 1 buy signal bar in a strong bull trend. But since at least a small 2nd leg down is likely and it is the 3rd consecutive bear bar, there will probably be sellers not far above yesterday’s high.
- Can these 3 bear bars be the start of a 15% correction? Of course, and a correction is becoming increasingly likely.
- However, I have been saying since the pandemic crash that it is more likely that every reversal down will be minor than the start of a bear trend. That is true here as well.
- One of these reversals will eventually lead to a correction, but picking which one is a low probability bet.
- The bears will need several more big bear bars before traders conclude that a correction might be underway.
Emini 5-minute chart and what to expect today
- Emini is down 15 points in the overnight Globex session. It will gap below yesterday’s low.
- If there is a gap down and it is small, it will probably close within the 1st hour.
- The bears want a 4th bear day. If there is a series of bear bars early in the day, today will more likely continue yesterday’s trading range and bear channel.
- If the bulls get a series of early big bull bars, today could be a bull trend day. However, today will have a difficult time getting much above yesterday’s trading range high.
- Trading ranges are magnets, and that increases the chance of either a trading range or a continuation of yesterday’s broad bear channel, which traders will trade like a trading range.
- Because the sell climax was extreme and yesterday was the 3rd consecutive bear day, the sellers might be exhausted. This increases the chance of a continuation of yesterday’s trading range.
- The bears want a resumption down from yesterday’s early selling and the bulls want a trend reversal up.
- But 3 big down days after a strong rally creates confusion. Yesterday’s trading range might not have lasted long enough for traders to bet relentlessly on either direction.
- Unless there is a series of strong trend bars in either direction, traders will look for reversals.
- Even if today is a trading range day, there should be at least one swing and probably two.
Yesterday’s Emini setups

Here are several reasonable stop entry setups from yesterday. I show each buy entry with a green rectangle and each sell entry with a red rectangle. Buyers of both the Brooks Trading Course and Encyclopedia of Chart Patterns have access to a much more detailed explanation of the swing trades for each day (see Online Course/BTC Daily Setups).
My goal with these charts is to present an Always In perspective. If a trader was trying to be Always In or nearly Always In a position all day, and he was not currently in the market, these entries would be logical times for him to enter. These therefore are swing entries.
It is important to understand that most swing setups do not lead to swing trades. As soon as traders are disappointed, many exit. Those who exit prefer to get out with a small profit (scalp), but often have to exit with a small loss.
If the risk is too big for your account, you should wait for trades with less risk or trade an alternative market like the Micro Emini.
EURUSD Forex market trading strategies
EURUSD Forex daily chart

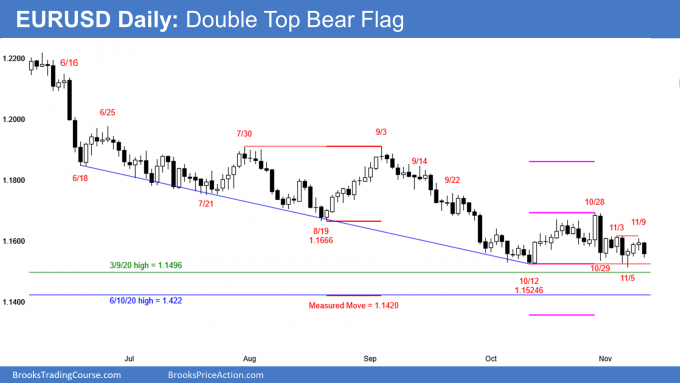
- Turning down from double top bear flag with November 3 high. Three consecutive bull bars so lower probability sell signal.
- Tight trading range for 8 days so Breakout Mode.
- Traders are deciding if the selloff will continue down to the March 9, 2020 high at around 1.15 or reverse up from a lower low major trend reversal.
- The tight trading range is a sign that the EURUSD is neutral.
- However, since the tight trading range is in a bear trend, the odds slightly favor a bear breakout. This is especially true since the March 9, 2020 high is an important magnet below.
- Even if the EURUSD continues down to 1.15 or 1.14, it should begin a reversal up for 2 or 3 months soon.
- Traders will need to see several big bull bars before they conclude that a rally has begun. Until then, the odds slightly favor a test below 1.15 before the reversal up will begin.
Summary of today’s S&P Emini futures price action and what to expect tomorrow

End of day summary
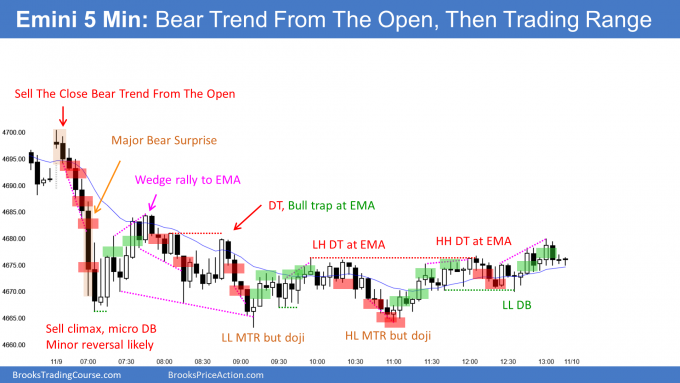
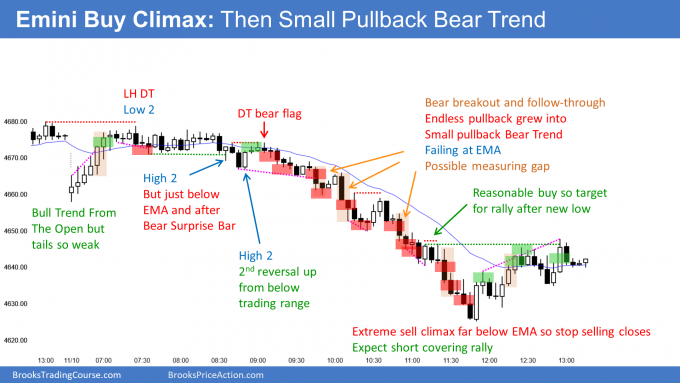
- The strong rally on the open stalled at the 60-minute EMA and the top of yesterday’s trading range.
- After a couple hours, the Emini sold off in an Endless Pullback that evolved into a very strong Small Pullback Bear Trend.
- There was a late short covering rally.
- On the daily chart, there are now 4 consecutive bear bars, which is a lot. It reduces the chance of a bear bar tomorrow.
- The 4-day selloff came after a strong rally on the daily chart. This creates a Big Up, Big Down, Big Confusion pattern, which typically leads to a trading range. Therefore, there is an increased chance of sideways trading for a few days.
- Is this the high of the year? It might be, but there have been many other attempts at a bear trend reversal and all have failed. Therefore, the odds continue to favor higher prices.
- After the extreme buy climax, the Emini might go sideways for a week or two.
- The bears need more bear bars before traders will conclude that a correction is underway. Traders will continue to bet on new highs until there is a clear, strong reversal down.
- The bear bar on the monthly chart in September was the 3rd attempt to end the rally from the pandemic low. I said at the time that the bear bar should lead to a 2nd bear bar in a month or two. That means the bears will try to create a bear bar in November. If they are successful, it will probably lead to lower prices in December.
See the weekly update for a discussion of the price action on the weekly chart and for what to expect going into next week.
Trading Room
Traders can see the end of the day bar-by-bar price action report by signing up for free at BrooksPriceAction.com. I talk about the detailed S&P Emini futures price action real-time throughout the day in the BrooksPriceAction.com trading room. We offer a 2 day free trial.
Charts use Pacific Time
When I mention time, it is USA Pacific Time. The Emini day session charts begin at 6:30 am PT and end at 1:15 pm PT which is 15 minutes after the NYSE closes. You can read background information on the market reports on the Market Update page.


Hi Al,
If you sell bellow big bear bar 11, do you get out above bar 14? It was a high 2? Thank you.
Thanks for your course i am able to apply the things i watch in your videos and it is very useful in live trading.
I bought and held few swing trades for the past couple of days (1hr chart)but ended today with minor loss.
I examined those trades and found that had i booked my partial profits at 1x reward i would have been in profits or at least covered the expenses but when the trade is alive i fail to notice these errors.
can we place limit order at 1% reward when we enter the trade?
or we can wait for how the trend progress and take profits accordingly?
Both are reasonable. If a person enters for a swing, it is better not to have a limit order to take profit at 1x risk. Instead, expect a couple legs and at least 10 bars before taking profits. If disappointed, exit.
A scalper probably will make less that 1x risk, but if his probability is high, that is okay. Scalpers often place bracket orders on entering. Most good traders will make more money swing trading.