Emini and Forex Trading Update:
Wednesday June 2, 2021
Pre-Open market analysis of daily chart
- Yesterday was outside down day. It is therefore an outside down sell signal bar for a double top with the May 7 all-time high.
- Because it closed below Friday’s low, there is an increased chance of a bear trend day today.
- Strong trends constantly form reversal setups, and 80% fail. Consequently, even though the bears have a double top on the daily chart, it is more likely to lead to a small pullback than a bear trend.
- Day after outside day often is inside day. Also, if not inside, it usually has a lot of overlap with prior day.
- Therefore, there are probably buyers around yesterday’s low, and not far below yesterday’s low, and sellers around yesterday’s high, and not far above.
- Buy climax on daily, weekly, and monthly charts, so can be big bear trend day and begin 2-month correction at any time.
Overnight Emini Globex trading on 5-minute chart
- Up 6 points in the Globex session.
- Yesterday had a midday lower low major trend reversal, and then a late higher low. The bulls want the reversal to continue up today.
- Because yesterday is a sell signal bar on daily chart, bears will try to break below yesterday’s low to trigger the sell signal.
- Tight trading range for 6 days, so reduced chance of big trend in either direction today.
- Day after outside day has increased chance of mostly overlapping the outside day.
- Yesterday was in trading range for most of the day.
- These factors increase the chance of a lot of trading range trading today. Traders will expect at least one swing up and one swing down.
- If there is a series of strong trend bars in either direction in the 1st hour, traders will look for a possible trend day.
Yesterday’s Emini setups

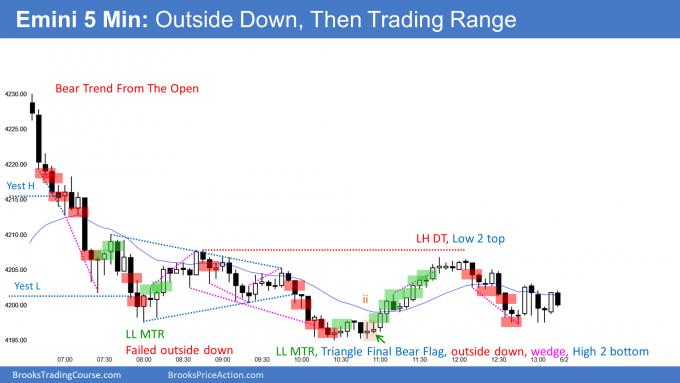
Here are several reasonable stop entry setups from yesterday. I show each buy entry with a green rectangle and each sell entry with a red rectangle. Buyers of both the Brooks Trading Course and Encyclopedia of Chart Patterns have access to a much more detailed explanation of the swing trades for each day (see Online Course/BTC Daily Setups).
My goal with these charts is to present an Always In perspective. If a trader was trying to be Always In or nearly Always In a position all day, and he was not currently in the market, these entries would be logical times for him to enter.
If the risk is too big for your account, you should wait for trades with less risk or trade an alternative market like the Micro Emini.
EURUSD Forex market trading strategies
EURUSD Forex daily chart

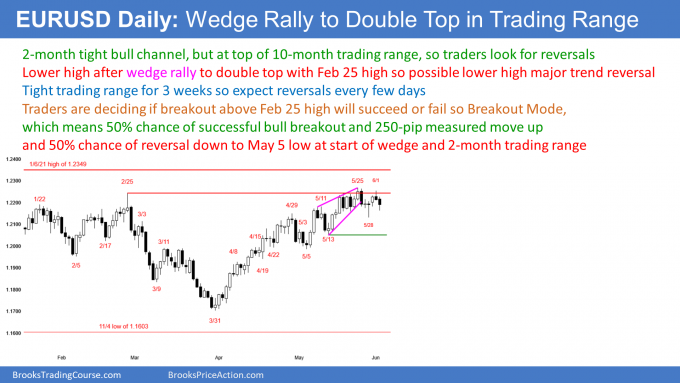
- 3-week tight trading range nested within 3-month trading range, which is nested within 5-year trading range. Traders continue to look for reversals on daily, weekly, and monthly charts.
- Yesterday was sell signal bar for lower high reversal, but the pattern from the May 25 high was small, and therefore traders expect only a minor reversal.
- Today triggered the lower high sell signal, but it is a reversal within a 3-week trading range, and it is more likely to last only 1 to 3 days.
- The bears want a reversal down from a wedge rally to a double top on the daily chart, but the EURUSD continues to reverse every few days.
- Traders will continue to look for reversals until there are at least a couple consecutive trend bars in either direction, and a breakout of the 3-week tight trading range.
Overnight EURUSD Forex trading on 5-minute chart
- Sold off in a strong bear trend overnight. By going below yesterday’s low, today triggered a sell signal on the daily chart.
- Once the selloff got to the bottom half of the 3-week range, it reversed up about an hour ago.
- The reversal up has been about 25 pips. That is enough for traders to expect the overnight bear trend to convert into a trading range. The odds are now against much lower prices today.
- Big Down, Big Up creates Big Confusion. That typically leads to a trading range.
- Day traders will switch to selling rallies, and scalping from selling at the market and swing trading.
- They will also now buy dips for scalps.
- Trading range likely for at least a couple hours.
- The fight will be over the midpoint of the day’s range and the open of the week. It will probably be about the middle of the developing trading range.
Summary of today’s S&P Emini futures price action and what to expect tomorrow
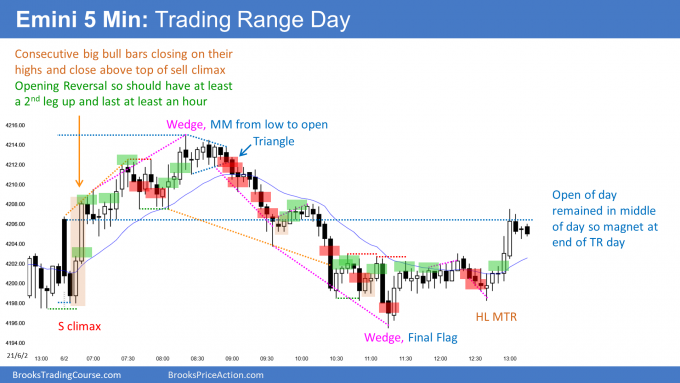
- Opening reversal up fro test of yesterday’s low.
- Small pullback bull trend was weak and reversed down from wedge rally to a measured move from the low to the open.

Here are several reasonable stop entry setups for today. I show each buy entry with a green rectangle and each sell entry with a red rectangle. Buyers of both the Brooks Trading Course and Encyclopedia of Chart Patterns have access to a much more detailed explanation of the swing trades for each day (see Online Course/BTC Daily Setups).
My goal with these charts is to present an Always In perspective. If a trader was trying to be Always In or nearly Always In a position all day, and he was not currently in the market, these entries would be logical times for him to enter.
If the risk is too big for your account, you should wait for trades with less risk or trade an alternative market like the Micro Emini.
End of day summary
- Opening reversal up from test of yesterday’s low.
- Weak wedge rally ended at measured move up from low to open.
- Reversal down to test low of day and yesterday’s low.
- Reversed up from ii and small double bottom, and it was a big double bottom with the low of the open.
- Inside day after outside day so ioi Breakout Mode pattern on daily chart.
See the weekly update for a discussion of the price action on the weekly chart and for what to expect going into next week.
Trading Room
Traders can see the end of the day bar-by-bar price action report by signing up for free at BrooksPriceAction.com. I talk about the detailed S&P Emini futures price action real-time throughout the day in the BrooksPriceAction.com trading room. We offer a 2 day free trial.
Charts use Pacific Time
When I mention time, it is USA Pacific Time (the Emini day session opens at 6:30 am PT, and closes at 1:15 pm PT). You can read background information on the intraday market reports on the Market Update page.


Dear Al,
I considered bar 26 a DT L2, lower high MTR and the second short entry after wedge top but I see your short setup at bar 28 instead. What should I beware about bar 26?
Thank you.
Selling below 22 or 26 was reasonable for a swing down, but the probability went up below 29. which closed on its low and therefore showed more conviction.