Emini outside down reversal at 2800 Big Round Number
Updated 6:48 a.m.
The Emini gapped up to the middle of yesterday’s huge range. This makes an inside day and a trading range day likely.
On the open, it reversed down from 2 legs up from yesterday’s low. The 2nd and 3rd bars were dojis. This is trading range price action. Therefore, traders will buy a selloff before it gets below yesterday’s low. In addition, they will sell rallies. The odds favor both at least one swing up and a swing down. The market is deciding will come first. At the moment, a down swing is underway.
If there is a strong series of trend bars up or down, today could still be a trend day. However, the odds are against it.
Pre-Open market analysis
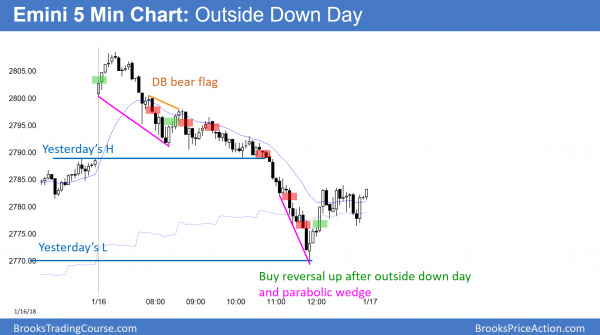
Yesterday, the Emini reversed down from a breakout above 2800 and became an outside down day. This was the 1st bear day in 2 weeks. The odds are that the past 2 weeks on the weekly chart will be an exhaustive buy climax. This means that there will be a reversal to test the bottom of the 2 bars. That is also a test of the open of the year. In addition, it will probably be a 5% correction down to the 20 week exponential moving average.
The two bull bars on the weekly chart are strong enough so that there might be one more leg up before a pullback. In addition, the reversal will be minor. This means that the bulls will buy the selloff, even if it is surprisingly big or lasts 2 – 3 months.
Has the selloff begun? The bears need a couple big bear bars on the daily chart or 3 – 4 smaller bear bars. Without that, the odds continue to favor higher prices. Furthermore, after 10 bull days, the odds favor a trading range before Friday’s vote on a government shutdown.
Overnight Emini Globex trading
The Emini is up 10 points in the Globex market. Look at any big bear bar on the daily chart over the past year. Most were followed by sideways to up prices over the next 1 – 3 days. Consequently, the odds are against a consecutive big bear trend day today. More likely, the Emini will spend a lot of time in the middle of yesterday’s big range. It probably will form an inside bar on the daily chart, and be mostly a trading range day.
However, whenever something is likely, traders always have to be ready for what is unlikely. The biggest trends up or down come from days that were likely to be trading range days.
Yesterday’s setups
Here are several reasonable stop entry setups from yesterday. I sometimes also show limit order entries and entries on the close of bars.
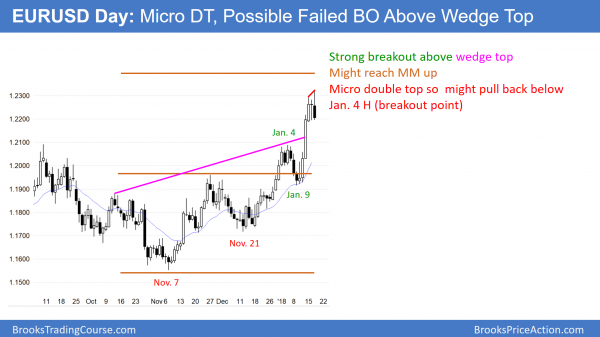
EURUSD daily Forex chart has micro double top
The EURUSD daily Forex chart is forming a micro double top with Friday’s high. The bears need a strong reversal down over the next few days. Otherwise, a bull flag and another leg up are more likely.
The EURUSD daily Forex chart broke strongly above a wedge top last week. In addition, the daily and weekly charts are in bull trends. The odds therefore favor higher prices after a pullback.
There is a 6 bar bull micro channel on the daily chart. That means that every low has been above the low of the prior day for 6 days. This is a sign of strong bulls. Usually, they will buy the 1st time the market falls below the prior day’s low. Therefore, if today falls below yesterday’s low, the selloff will probably not get very far nor last more than a couple of days. The odds favor sideways today and tomorrow rather than very far down.
Friday’s vote on a government shutdown is an important catalyst for all financial markets. Therefore, they might start to go sideways before the vote.
Look at every reversal down on the daily chart. The majority began with either a micro double top or a small double top. Similarly, most reversals up from selloffs typically begin with micro double bottoms or small double bottoms.
The daily chart’s overnight reversal down is forming a micro double top with Friday’s high. Furthermore, there is a wedge bear flag on the monthly chart. Consequently, the bears have a 40% chance of a reversal down beginning within the next week. They need 2 – 3 consecutive big bear trend bars closing on their lows on the daily chart before traders will conclude that the trend has changed to down. Until then, any reversal will more likely be a bull flag. This means the bull trend is likely to continue for at least one more leg up.
Overnight EURUSD Forex trading
The 5 minute chart broke to a new 3 year high overnight, but then reversed down 100 pips. As a result, the 60 minute chart formed a higher high major trend reversal. All major reversals have a 40% chance of leading to an opposite trend. Hence, there is a 40% chance of a swing down over the next few weeks on the 60 minute chart.
The selloff on the 5 minute chart lacked consecutive big bear bars. It therefore looks more like a bear leg in a big trading range instead of the start of a bear trend. In addition, the chart has been in a 40 pip trading range for 5 hours. Traders are deciding if the selling will continue to below yesterday’s low.
The momentum down overnight is strong enough for the selloff to fall below yesterday’s low today. If there is no pullback on the daily chart today, it will probably come tomorrow. In either case, the odds are that there will be buyers below yesterday’s low. Therefore, the bear breakout will probably reverse back up within a day or two, and the 3 day trading range will probably continue, at least until Friday’s vote.
Summary of today’s S&P Emini futures price action and what to expect tomorrow
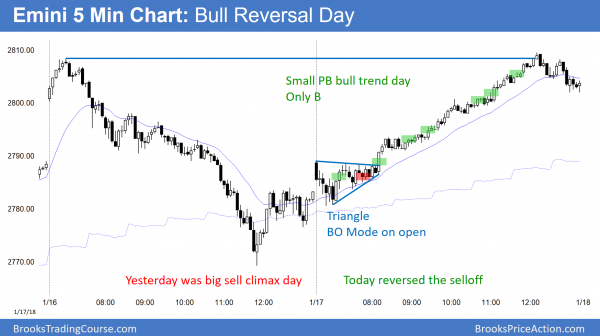
The Emini gapped up and pulled back in a triangle to the moving average. The bull breakout became a small pullback bull trend day.
The bulls reversed yesterday’s sell climax. However, the Big Down yesterday and Big Up today create confusion. Therefore, there is an increased chance of a lot of trading range trading tomorrow. This is especially true ahead of Friday’s government shut down vote.
See the weekly update for a discussion of the price action on the weekly candlestick chart and for what to expect going into next week.
Traders can see the end of the day bar-by-bar price action report by signing up for free at BrooksPriceAction.com. I talk about the detailed S&P Emini futures price action real-time throughout the day in the BrooksPriceAction.com trading room. We offer a 2 day free trial.
When I mention time, it is USA Pacific Standard Time (the Emini day session opens at 6:30 am PST, and closes at 1:15 pm PST). You can read background information on the intraday market reports on the Intraday Market Update page.


Yes, my mistake. I just fixed it.
Thanks,
Al
The two “bears bars” on the weekly chart are strong enough so that there might be one more leg up before a pullback.
bull bars?