Trading Update: Friday April 22, 2022
Emini pre-open market analysis
Emini daily chart
- Emini oscillating at middle of 9-month trading range.
- Below is a comment Al wanted to add regarding the Emini:
- “The Emini has been oscillating around 4,400 for 9 months. That price might well end up being the middle of the trading range. Since the top of the range is about 400 points higher, the bottom could be 400 points lower. That is below the February low and around the 4,000 Big Round Number. If it gets there, traders will then wonder if the Emini might fall for a measured move down from the February/March double top. That would fill the gap above the March 2021 high on the monthly chart.”.
- The point Al is making is that the market is in the middle of a 9-month trading range, and if the market falls below the February low, there is a magnet below the March 2021 gap, which is close to 3,940.
- Also, the 4,000 big round number was never reached, which is another reason for the market to sell off if it falls below February’s low.
- If the market does fall below the February low, the risk is real that the Emini could get a measured move down from the February – March range, which could drive the market down to 3,700.
- The risk of a breakout below the February low is real and should not be ignored.
- Yesterday, the bears got a huge bear trend bar, completely reversing the past two days. This bar is a surprise bar and likely to lead to a little more down.
- While the bears hope today will be another big bear trend bar, the market is in a trading range, though, which means the bears will likely be disappointed today. This means that the odds favor a bull day or some kind of weak doji.
- Today is Friday, so the weekly chart is important. Below are a couple of things to note regarding the weekly chart:
- The Open of the week is 4,376.25. This is close enough to the current price that it will likely be a magnet all day. Traders should pay attention to this price level and know that the final hour can have a big move up or down due to the weekly chart.
Emini 5-minute chart and what to expect today
- Emini is down 5 points in the overnight Globex session.
- The Globex session has been in a trading range since yesterday’s U.S. Session close.
- Yesterday was a very climactic day, which means there is a 75% chance the market will go sideways for two hours and possibly all day. This means traders will expect a limit order market and a trading range open.
- As always, traders should consider waiting for 6-12 bars if they have trouble with sideways opens.
- Traders can also wait for a credible stop entry, such as a double top/bottom, wedge top/bottom, or a strong breakout with follow-through.
- Again, today is Friday which means there is an increased chance of a surprise move late in the day due to the traders deciding on the weekly chart close.
Yesterday’s Emini setups

Al created the SP500 Emini charts.
Here are several reasonable stop entry setups from yesterday. I show each buy entry with a green rectangle and each sell entry with a red rectangle. Buyers of both the Brooks Trading Course and Encyclopedia of Chart Patterns have access to a much more detailed explanation of the swing trades for each day (see Online Course/BTC Daily Setups).
My goal with these charts is to present an Always In perspective. If a trader was trying to be Always In or nearly Always In a position all day, and he was not currently in the market, these entries would be logical times for him to enter. These therefore are swing entries.
It is important to understand that most swing setups do not lead to swing trades. As soon as traders are disappointed, many exit. Those who exit prefer to get out with a small profit (scalp), but often have to exit with a small loss.
If the risk is too big for your account, you should wait for trades with less risk or trade an alternative market like the Micro Emini.
EURUSD Forex market trading strategies
EURUSD Forex daily chart

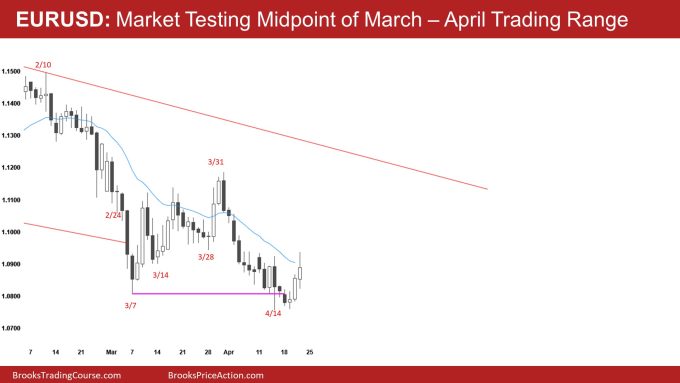
- The EURUSD had a bear signal bar yesterday. One can call it a Low 1 or a Low 2 (double top); it does not matter. What matters is that the signal bar is big and forcing traders to sell in the middle of a 9-bar tight trading range, which is not ideal.
- Yesterday also came within ten pips of the March 28 low. Bulls would have bought the March 28 low during the April 5 selloff and bought more lower, confident they could exit the trade breakeven on first with a profit on their second. Since the market came within ten pips of the March 28 low, it will probably have to close this breakout point.
- The odds favor yesterday’s bear stop entry failing and the market reversing up, which is what it looks like will happen. This may increase the odds of today having a close above the open or at least a weak bear body closing above yesterday’s low.
- The bears hope that yesterday will lead to a successful double top (April 14 & April 21).
- The bears also want a measured move down, breaking below the March – April range and testing the 2020 price levels.
- The bulls want a test back up to the March high and ultimately reach the bear trend line above, which they probably will.
- Today is a Friday, so the weekly chart is important. Few things to note on the Weekly chart:
- Currently, the weekly chart is close to the open of the week (1.0805), which means the open of the week might be a magnet all day as traders fight over a bull or bear close on the weekly chart.
- Since last week broke below the March 11 low (weekly chart), the bulls want this week to have a bull close which would be lousy follow-through for the bears, increasing the odds of a failed breakout below March 11.
- As always, the day session has the potential for a big/surprise move as traders fight over the weekly chart close in the final hours of the day.
Summary of today’s S&P Emini futures price action and what to expect tomorrow

Al created the SP500 Emini charts.
End of day summary
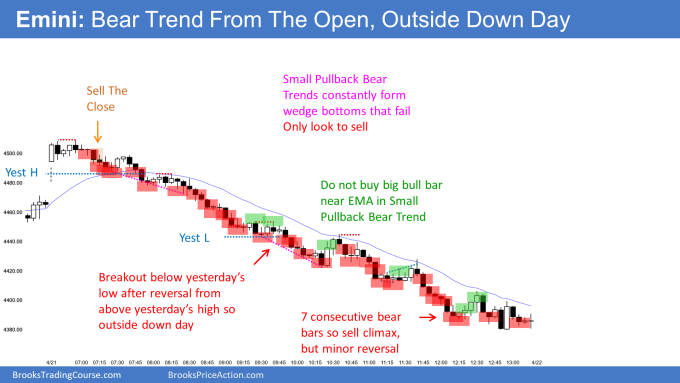
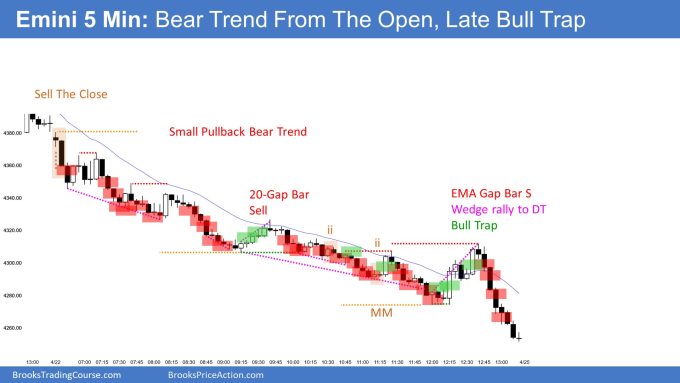
- Today was a bear trend from the open closing far below the past several bars on the daily chart. The daily chart has two consecutive bear bars, which will probably lead to a second leg down and a test of the February lows.
- Today was a very strong bear trend day, and it is essential to not be in denial of the bear trend.
- The bulls were unable to create a strong trendline break. This means the best the bulls could expect was sideways.
- The first close above the moving average was around 12:15 PT which meant the bears were exceptionally strong.
- Overall, the past two trading days have been very strong and will likely lead to follow-through selling over the next several days.
- As stated on the daily chart section of the blog, the bears have a credible shot at breaking below the February low and getting a measured move down based on the February – March trading range.
See the weekly update for a discussion of the price action on the weekly chart and for what to expect going into next week.
Trading Room
Traders can see the end of the day bar-by-bar price action report by signing up for free at BrooksPriceAction.com. Al talks about the detailed S&P Emini futures price action real-time throughout the day in the BrooksPriceAction.com on trading room days. We offer a 2 day free trial.
Charts use Pacific Time
When times are mentioned, it is USA Pacific Time. The Emini day session charts begin at 6:30 am PT and end at 1:15 pm PT which is 15 minutes after the NYSE closes. You can read background information on the market reports on the Market Update page.


What do you think the percentage is that the last two days are a second leg bear trap?
The past two bear days are big enough so that the odds favor a second leg down and a test of the March 14 low.
Most traders are probably better off waiting for a couple of legs down before buying.
Dear Brad, although I am not a big fan of FIB retracement, I notice that on the monthly chart we are approaching the 23.6% FIB level (as already happened in February and March 2022). If it happens again we could either experience an uptrend as happened in late February and mid-March, or we could slide towards the FIB 38.2% level which is even further down from that significant March 2021 point that Dr. Brooks had already identified months ago. Next week will be crucial to see if the Bears will let go (I don’t think so) and give Bulls some respite, or if they will instead push down. It is also a week of important ERs (FB, AMZN, BA to name a few). We’ll see. Have a great weekend
Thanks for the report Brad and obviously Dr. Brooks for your work.
I was wondering why bar 13 has not been marked a buy? I thought the context was good – the day before yesterday was climactic selling day so after initial follow through selling, odds were the market would have traded sideways to up for a couple hours. Bar 13 low was also around the low of Leg 1(Bars 1-3) = Leg 2 (Bars 8-12) MM so near a support. One could also look at it as a DB with Bar 3 and the EMA was still far up.
Only thing I can think of against taking the trade is the bar is quite small.
Thanks again.
Bar 13 is following 4 consecutive bear bars, do you really want to be buying after that much selling pressure? Even if you claim that it is a sell climax, usually there is at least one more leg down after a climax to form a micro double bottom. Remember, every climax is also a breakout, so if you’re assuming that it’s a climax, you’re disregarding the potential that it can also be a successful breakout. Bar 1 to Bar 3 was a strong bear breakout below a bear channel line which then had two attempts to reverse up, but instead formed a second entry short at Bar 9. The market tried to reverse up but failed and became a trend continuation trade after the strong bear breakout move from Bar 1 to Bar 3 breaking below the bear channel line. The market responded bearishly off the second entry short at Bar 9, leading to four consecutive bear bars to Bar 13, where you would’ve wanted to buy. This was too much selling pressure. The market had already shaved off a bit of excess by forming the correction after the bear move to Bar 3. The incoming strength to Bar 13 was too strong, and if you want to counter trend against a strong move, you need a strong showcase of strength by the bulls which was not apparent.
Thanks for your reply, although I still have a few points of contention, I realise this is not the right place to discuss. Hopefully, you and other members can share their insights on the Support forum where I plan to post such doubts in the future. Thanks once more.