Trading Update: Friday February 25, 2022
Emini pre-open market analysis
Emini daily chart
- Yesterday reversed up strongly from a breakout below the January OO sell signal bar on the monthly chart.
- That low was also the bottom of a 7-month trading range.
- Yesterday was a big bull bar closing near its high. It is therefore a strong buy signal bar on the daily chart. The bulls are hoping that yesterday will be the end of the 2-month correction. If it is not, the reversal up was so strong that a new low will probably not be much lower.
- If there is one more leg down, a reversal up would be a wedge bottom, where the 1st 2 legs were January 24 and yesterday. That would probably be the final low, although there is often test of a wedge bottom that goes slightly below the wedge.
- The bulls currently see the 2-month selloff as a wedge bull flag with the December 3 and January 24 lows.
- I have been saying that the Emini would break below the January low, which would trigger the OO sell signal on the monthly chart. Yesterday triggered the sell signal.
- However, I also said that the bull trend was strong enough on the monthly chart for the reversal to be minor, which means that it would last 2 – 3 months.
- February is the 2nd month, and yesterday is a reasonable candidate for the end of the correction.
- There are 2 important things that we do not yet know.
- The first is whether yesterday will be the final low, or if there will be a bounce and one more leg down.
- The second is once the selloff ends, will the bull trend resume or will the Emini go sideways for many months and possibly all year.
- We need more information, and more information means more bars.
- If the bulls can create several consecutive bull bars on the daily chart closing near their highs, the odds will favor a resumption of the bull trend.
- Today’s strong reversal up after the January 24 strong reversal up means there is good buying pressure. That makes much lower prices unlikely, but there is still a 50% chance that there will be one more leg down after a bounce.
- The next targets below are the 4,000 Big Round Number, a 20% correction (3,846 based on the March contract, which would mean a bear market), and the gap above the March 2021 high of 3,858.25.
- There is only a 30% chance that the selloff will continue down for a measured move to around the pre-pandemic high (February 2020 high of 3318), which would be a 31% correction.
Emini 5-minute chart and what to expect today
- Emini is up 25 points in the overnight Globex session.
- Since yesterday was a buy climax day, there is a 75% chance of at least a couple hours of sideways to down trading that starts by the end of the 2nd hour today.
- Yesterday is a buy signal bar on the daily chart and the context is good for the bulls. Today will probably trigger the buy signal by going above yesterday’s high.
- If today gaps up, the gap might be relatively small. If so, small gaps typically close early in the day.
- Since the context on the daily chart is good for a reversal up, there is an increased chance of a bull trend day today.
- However, yesterday was a huge day. That means the stop for the bulls is far below. That increased risk will reduce the number of bulls who will buy above yesterday’s high. Many will prefer to buy a pullback, which would have less risk. That increases the chance of a few sideways days, like after the January 24 big buy signal bar.
- Today is the last day of the week so weekly support and resistance can be important, especially in the final hour.
- The bulls want this week to be a good buy signal bar on the weekly chart for a High 2 bull flag with the January 24 low. They therefore want the week to close far above the open of the week. If they succeed, that will increase the chance of higher prices next week.
- It is unlikely that the bears will get the week to close near its low. At a minimum, they want the week to close below the midpoint of the week. That would increase the chance of sideways to down trading next week.
Yesterday’s Emini setups

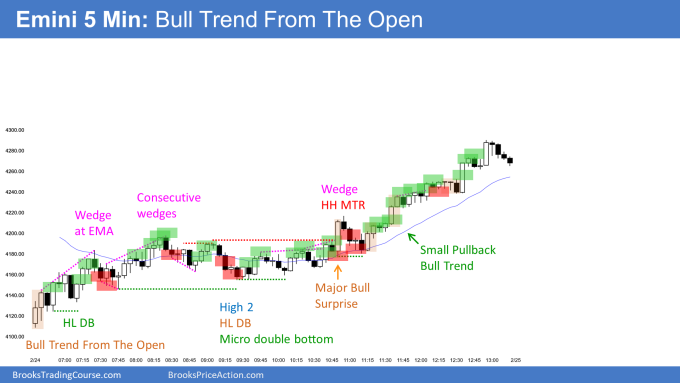
Here are several reasonable stop entry setups from yesterday. I show each buy entry with a green rectangle and each sell entry with a red rectangle. Buyers of both the Brooks Trading Course and Encyclopedia of Chart Patterns have access to a much more detailed explanation of the swing trades for each day (see Online Course/BTC Daily Setups).
My goal with these charts is to present an Always In perspective. If a trader was trying to be Always In or nearly Always In a position all day, and he was not currently in the market, these entries would be logical times for him to enter. These therefore are swing entries.
It is important to understand that most swing setups do not lead to swing trades. As soon as traders are disappointed, many exit. Those who exit prefer to get out with a small profit (scalp), but often have to exit with a small loss.
If the risk is too big for your account, you should wait for trades with less risk or trade an alternative market like the Micro Emini.
EURUSD Forex market trading strategies
EURUSD Forex daily chart

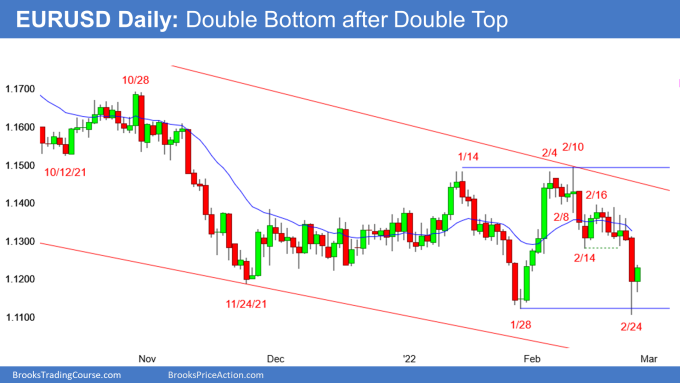
- Yesterday was a big bear day and it broke below the January 28 low. However, it closed far above that low.
- The bears hope that it will lead to a 400-pip measured move down, based on the height of the 4-month trading range. They need consecutive bear bars closing below the January 28 low before traders will believe that the bear breakout will be successful.
- The bulls want yesterday’s breakout to fail. They want today to continue to be a bull bar, and they want it to close near its high. It would then will be a buy signal bar for a lower low double bottom.
- They then want a break above the 4-month range and a 400-pip measured move up. But they need consecutive bull bars closing above the February 10 high to convince traders that the bull breakout will succeed.
- Which is more likely? Until there is a breakout with strong follow-through, the odds favor that breakout attempts up and down will fail and the 4-month trading range will continue.
- However, because the EURUSD has been in a trading range for 7 years and the current leg down has lasted an unusually long time, traders should expect a rally lasting at least a couple months before the EURUSD trades much lower.
- If there is a bear breakout, the bulls will make another attempt at a bottom around the March 2020 low. That would be a higher low double bottom in the 7 year range, and the current range would then be a likely Final Bear Flag.
Summary of today’s S&P Emini futures price action and what to expect tomorrow

End of day summary
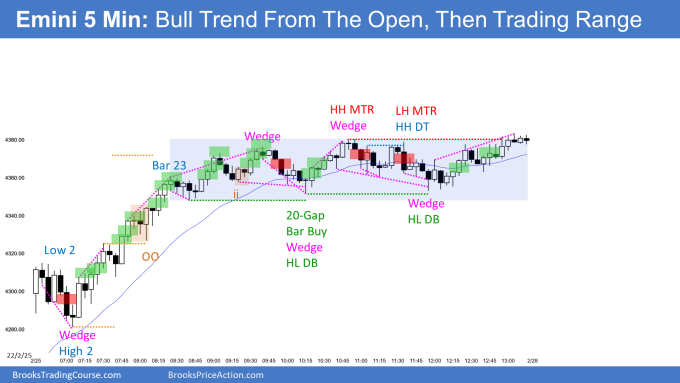
- Today began with a Bull Trend From The Open.
- Since yesterday was a buy climax day, there was a 75% chance of at least a couple hours of sideways to down trading that starts by the end of the 2nd hour.
- While the Small Pullback Bull Trend lasted until Bar 38, the trading range began at Bar 23 or 31.
- There was a minor reversal down to the EMA and at least 3 bars with lows below the EMA, which happens 99.5% of the time.
- A 20-Gap Bar buy setup led to a new high, but the trading range continued until Bar 68. There was then some trend resumption up.
- There are now consecutive big bull bar closing near their highs on the daily chart. That is good buying pressure, and it follows several other big bull bars starting on January 24.
- This repeated strong buying reduces the chance of the Emini falling much further.
- There is a 50% chance that yesterday will be the low of the year. March and April form the pair of consecutive months that is the most bullish of the year, and therefore the Emini is entering a timeframe that has an upward bias.
- In addition, if there is a break below yesterday’s low, the Emini might dip below 4,000, but traders will buy it. There would likely be a reversal up, and the selloff from the January high would then be a wedge bull flag where January 24 and February 25 were the 1st 2 legs down.
- There is currently a wedge bull flag where the 1st leg down was either the December 1 or the December 20 low.
- This week closed near its high. It is a High 2 buy signal bar on the weekly chart.
- For the past several months, I have been saying that there should be a selloff on the monthly chart with either 2 or 3 bear bars. Two was more likely. I said that there might be a bull bar in between.
- There is one trading day remaining in February, and February will probably have a bear body. It would then be the 2nd bear bar, and probably the end of the correction. I talked about this in my video about what to expect for 2022.
- The selloff is probably over or nearly over. What we don’t yet know is whether the 7-month trading range will continue or if the bull trend will resume.
- What about Ukraine and interest rate hikes? Traders currently doubt the war will hurt US earnings very much, and they already know that the Fed will raise rates many times.
- The selloff was a repricing due to those factors, and the chart patterns foretold of the selloff. They showed what traders were thinking.
- Since the world’s economy has always been in a bull market on the yearly chart, that bull trend should resume either now or next year, without much more selling.
- But, as I said in the video, the stock market is very overbought. The average gain over the past century is 8% a year, and the gain over the past decade is far greater. It will need about a decade in a trading range for the fundamentals to catch up to the price. That trading range can begin at any point within the next few years.
See the weekly update for a discussion of the price action on the weekly chart and for what to expect going into next week.
Trading Room
Traders can see the end of the day bar-by-bar price action report by signing up for free at BrooksPriceAction.com. I talk about the detailed S&P Emini futures price action real-time throughout the day in the BrooksPriceAction.com on trading room days. We offer a 2 day free trial.
Charts use Pacific Time
When I mention time, it is USA Pacific Time. The Emini day session charts begin at 6:30 am PT and end at 1:15 pm PT which is 15 minutes after the NYSE closes. You can read background information on the market reports on the Market Update page.


So the dip is over and by end of Monday/Tuesday we should start buying SPY again?
As Al said above, there are two things we do not know yet. First is whether or not this is low, or if the market will fall below February and make one more new low and reverse back up. Second, will the market go straight up from here and test the all-time high, or will the market go sideways for months, or possibly a year in a trading range.
So the key is how one manages the trade.
I see some questions being continually repeated over time. Is it possible to introduce a FAQ section, maybe as a link below the daily report so that they need not be answered over and over again? Those who do answer such questions could just direct the OP to such FAQ section.
Hi Abir,
Good idea. I created the Q&A support forum to address this repeated questions problem for general course and trading queries, but it hasn’t really slowed the same questions coming through. But it likely does help handle plenty of queries I am not aware of.
Maybe I could modify the temporary forum created earlier this month and make it a Q&A. Let me try that.
Can then add link in author’s profile to same and see how it goes.
Hi Richard. Modifying the temporary forum into Q&A does not sound like something that will prevent repetitive questions coming here. If the OPs asking such questions do not post them there, it will after all be pointless. I really think something like a FAQ section would be helpful. For example, I always see people asking if the MA takes globex data into account or not or why the data on some people’s chart does not match what Dr. Brooks is using. Such questions do not add value on this forum and waste time, in my personal opinion. I leave the rest on your discretion, you are the one who will take the decisions after all. All the best!
Is the 20 EMA figured on Regular Trading Hour session only or is it taking the Overnight into account also—- that makes a difference at the time of open….
Al’s charts shows the daily without the globes session so the moving average only takes into account the day session bars which is why I moved quickly on the open.
Is buying above the bar 1 (strong bull reversal bar) a low probability trade because the strong moves on the open have an 80% chance of failure?
In general, the first bar of the day has an 80% chance of failing and only leads to the low/high of day one day a week.
In this case, bar 1 is a big bull bar after consecutive buy climaxes at the end of Thursday’s intense bull trend day. This increases the odds of bar 1 not being the low of the day and the market going sideways.
However, when you get a bar like a bar 1 in the context of a tight bull channel like yesterday, the odds favor sideways. This means traders will be happy to buy below bar 1 as they did on bar 6 better on a failed breakout below 1.
Given the context before bar 23 was a small pullback bull trend, why was the entry above bar 25 not marked, given that it is a bull reversal bar?
You are correct. Small pullback bull trend, so buy for any reason and use a wide stop. I suspect Al did not mark bar 25 because it is a H1 buy after several buy climaxes, and price has not touched the moving average.
Trends tend to get weaker over time, which means the pullbacks should become more complex and last longer.
Also, bar 25 is more of a doji bar (small body compared to tail), overlapping the past 2 bars. Both of these reasons increase the odds of sellers above the bar.
Reference the Emini premarket analysis. Could you please confirm if there is a possible point typo in the comment, “gap above the March 2021 high of 3,858.25.”
I’m charting on the Emini continuous contract, U.S. only session. I show the March 2021 high was 3983.75 (on March 31, 2021). Is there a possible correction to the cited 3858.25 point value? If the cited point reference is correct, I recognize it is yet another significant (125 point) discrepancy between chart data on different trading platforms.
Thank you very much if any of the analysts have time to clarify.
There are lots of data vendors and each has its own way of calculating prices. I do not know who your data vendor is. I am using the continuous day session chart from TradeStation, and they get their data from the CME. The CME owns the Emini, and it therefore gets to decide what the prices are. When traders want the exact price, the CME is the only 100% accurate source.
Happy Birthday Al and thank you for amazing education!
Hi Al, very Happy Birthday and I see you’re coming to London, my country. I’ve followed you since your buying your first book back in 2009 or so. I’d love to meet you if just briefly to shake your hand :0)
Happy Belated Birthday Dr Brooks!
Al – loved your live trading room session yesterday (2/24) – and belated happy birthday! Thank you for sharing your passion with us.
Thanks Al. Happy belated birthday.