Posted 7:18 a.m.
The Emini opened with a trading range open in a strong bull trend. It will decide between closing above yesterday’s high, creating an all-time weekly high close, or below weekly support below. Traders need to see a strong breakout up or down, with follow-through, before swing trading. Since the targets above and below are close, the Emini might end up testing both today. At the moment, the Emini is always in long, but it more likely is in a trading range. There is a reasonable chance of a test down to the weekly support at some point today.
Today is Friday so last week’s high of 2013 and this week’s open of 2012.75 are magnets, as are last week’s close and the September high. The daily and 60 minute charts are extremely overbought. This is the 3rd day up from the pullback below the 14 day bull microchannel so the pullback should begin today or Monday.
Day trading outlook for tomorrow’s Emini price action

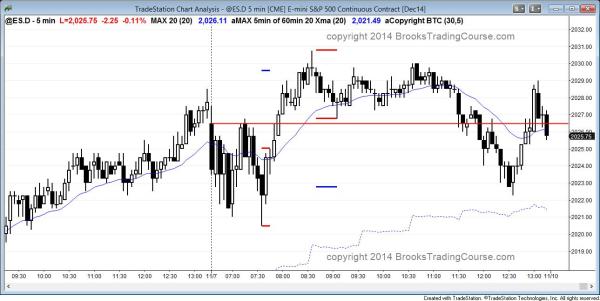
The Emini had a double bottom opening reversal and then a bull breakout. The trading range that followed had a lower high major trend reversal and a bear breakout. However, the leg down lacked consecutive strong bear trend bars, making it more likely a bear leg in a trading range day. The Emini turned up from above the bottom of the earlier bull reversal. The close was near the open and the day became the 5th doji day in the past 6 days.
Premarket price action analysis
See yesterday’s intraday market update report for today’s premarket analysis. Once there, scroll down to the heading, Day trading outlook for tomorrow’s Emini price action.
See the weekly update for a discussion of the weekly chart and for what to expect going into next week.
Traders can see the end of the day bar-by-bar price action report by signing up for free at BrooksPriceAction.com. I talk about the detailed Emini price action real-time throughout the day in the BrooksPriceAction.com trading room, and a 2 day free trial is available.
When I mention time, it is USA Pacific Standard Time (the Emini day session opens at 6:30 am PST, and closes at 1:15 pm PST). You can read background information on the intraday market reports on the Intraday Market Update page.


Thanks Al. I appreciate these updates and find them quite helpful as a general guide for how to view the day. Quite big overlapping bars on the 5 min today.