Trading Update: Tuesday August 23, 2022
Emini pre-open market analysis
Emini daily chart
- Emini likely bounce to form lower high.
- Yesterday was a good bar for the bears and increases the odds that the first reversal up will fail and lead to a lower high.
- The market is testing down to support and may have to reach the 4,000 big round number before it turns back up. However, the market may have to bounce first and form a lower high before the test of 4,000 happens.
- The bears hope this selloff will ultimately breakout below the June 16 low (neckline) and get a measured more down; however, this is not likely.
- More likely, the market is in a trading range and will continue going sideways in this current range.
- While the bears have done a good job over the past two trading days, since the market is in a trading range, they will likely be disappointed today or tomorrow. This means traders expect some kind of disappointment bar that could come in the form of a doji bar or bull bar.
- The bulls see this current selloff as a higher low forming in a new bull trend.
- Overall, the selloff down to yesterday’s close is enough to disappoint the bulls that bought anywhere over the past five days; this means they will likely exit on a bounce, and the market will get a 2nd leg down.
- The bears may not be eager to sell this close since they know bulls are expecting a bounce so that they can sell at a higher price. The reasons above make me think that the market will go sideways over the next couple of days.
Emini 5-minute chart and what to expect today
- Emini is down 10 points in the overnight Globex session.
- The Globex market is currently neutral with a lot of trading range price action overnight.
- At the moment, it does not appear that the market will have a significant gap on the open of the U.S. Session.
- Traders should assume that today will be a trading range, or a bull trend day, for the reasons stated above (disappointed bears on the daily chart).
- As always, traders should assume the open will be a limit order market, and most traders should wait for a credible stop entry or a strong breakout with follow-through.
- Traders should also consider waiting for 6-12 bars before placing a trade. This is because the market often just goes sideways for the first hour.
- Traders can wait for a credible stop entry, such as a double top/bottom or a wedge top/bottom.
- Lastly, traders can consider waiting for a strong breakout with follow-through on the open.
- The single most important thing to remember on the open is to be patient. Most opens are confusing, and it is easy to get trapped buying too high or selling too low.
- The biggest thing a trader can do on the open is just be patient. If the market is in a trading range, do not bet on breakouts since 80% of them will fail.
- Remember, the key to profitable trading is to stop taking dumb trades with poor math. Most traders have plenty of profitable trades; they take too many bad trades where the math is poor. These trades eat away at the person’s hard-earned profit, which prevents them from being profitable long term.
Yesterday’s Emini setups

Al created the SP500 Emini charts.
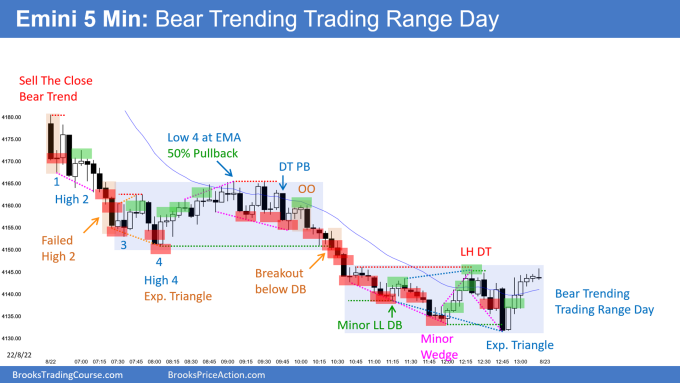
Here are several reasonable stop entry setups from yesterday. I show each buy entry with a green rectangle and each sell entry with a red rectangle. Buyers of both the Brooks Trading Course and Encyclopedia of Chart Patterns have access to a much more detailed explanation of the swing trades for each day (see Online Course/BTC Daily Setups).
My goal with these charts is to present an Always In perspective. If a trader was trying to be Always In or nearly Always In a position all day, and he was not currently in the market, these entries would be logical times for him to enter. These therefore are swing entries.
It is important to understand that most swing setups do not lead to swing trades. As soon as traders are disappointed, many exit. Those who exit prefer to get out with a small profit (scalp), but often have to exit with a small loss.
If the risk is too big for your account, you should wait for trades with less risk or trade an alternative market like the Micro Emini.
EURUSD Forex market trading strategies
EURUSD Forex daily chart

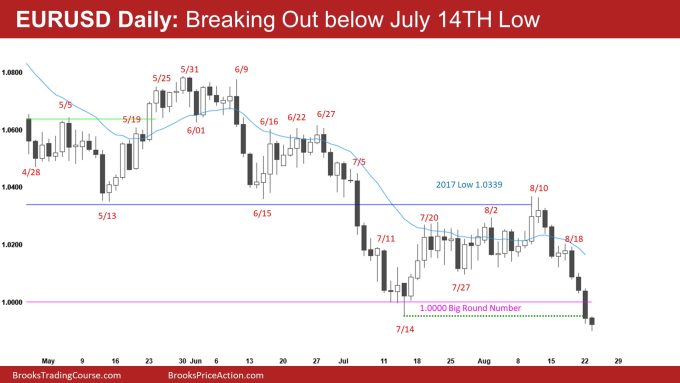
- The bears have had a strong selloff over the past week, testing the 1.000 big round number and the July 14 low.
- Yesterday closed below the July 14 low and was a big bear bar closing near its low. While this is good for the bears, the problem with yesterday’s bar is that it is climactic and may lead to sideways trading over the next few trading days.
- Take a look at August 15th; while it was not as climactic as yesterday’s bar, it was still a sell climax that led to two days of sideways trading. This makes me think today and tomorrow will disappoint the bears.
- So far, the bears are doing a good job of showing signs of strength. The bears hope that this is a strong enough bear breakout below the July 14 neckline to lead to a measured move down. While this is possible, it is not likely.
- At the moment, the selling pressure is good for the bears, and the first reversal will likely fail. This means that while the market is at support, the bulls probably do not want to buy here unless the market can form some micro double bottom first.
- While the odds eventually favor the market getting back to the middle of the June – July trading range, this selloff down to the July 14 low is a problem for the bulls. The selloff is stronger than what traders expected and increases the odds of being more sideways.
- The first reversal is likely minor, so the best the bulls can hope for is sideways until they can develop more selling pressure.
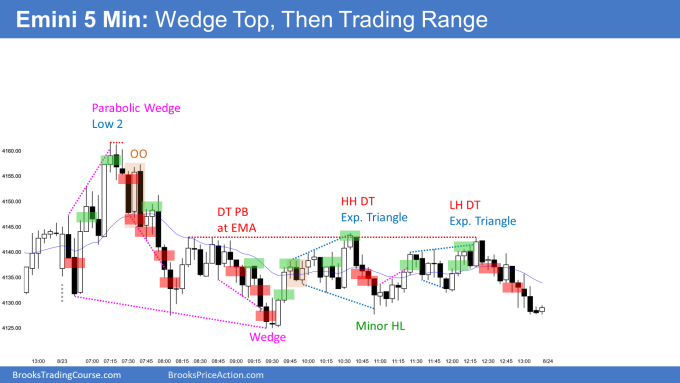
Summary of today’s S&P Emini futures price action and what to expect tomorrow

Al created the SP500 Emini charts.
End of day video review
See the weekly update for a discussion of the price action on the weekly chart and for what to expect going into next week.
Trading Room
Traders can see the end of the day bar-by-bar price action report by signing up for free at BrooksPriceAction.com. Al talks about the detailed S&P Emini futures price action real-time throughout the day in the BrooksPriceAction.com on trading room days. We offer a 2 day free trial.
Charts use Pacific Time
When times are mentioned, it is USA Pacific Time. The Emini day session charts begin at 6:30 am PT and end at 1:15 pm PT which is 15 minutes after the NYSE closes. You can read background information on the market reports on the Market Update page.


Hi Brad, can you please shed some light on the timing of this pre-market post? I am based out of Australia. I don’t expect an exact time, but just a ballpark will do.
The premarket report gets with the rest of the report around 10-15 minutes before U.S. Session starts.
Post is issued at 6:20am PT / 9:20am ET every day.