Posted 6:45 a.m.
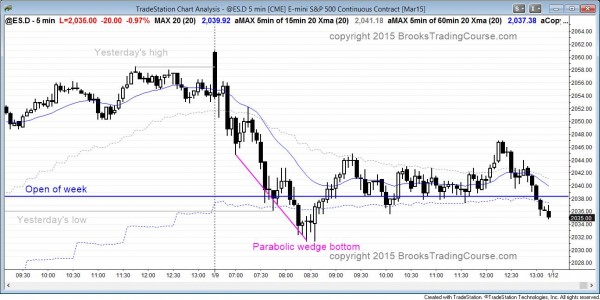
The Emini opened with a huge bear trend bar and that made the Emini always in short. It might bounce and test yesterday’s high, but at the moment, the odds are probably 50% or better that we have seen the high of the day. The head and shoulders bottom measured move target is at 2063.25 and the market might try to get there today, but the huge bear bar on the open is enough to make a bull trend day unlikely. A trading range day is most likely, and a bear trend day is next most likely.
The Emini is still within yesterday’s trading range. Swing traders will wait a breakout with follow-through in either direction. Until then, traders will mostly scalp, buying low and selling high.
My thoughts before the open: trend reversal or trend resumption
The Emini has had a strong 3 day rally with no clear top yet. However, it reached what I thought was its goal. The bulls have done enough to make the bears question the current wedge top on the daily chart, and wonder if there will be one more new high. The bulls are now wondering if the bears will begin to sell aggressively, now that the Emini is above middle of the current 60 minute bear leg. This confusion increases the chances of a trading range day, despite the strong move up in the premarket on the unemployment report. The Emini is choosing between trend reversal and trend resumption on the 5 minute and 60 minute time frames. The 5 minute bulls are in a bull trend and want any trading range to have trend resumption up. The 60 minute is still below the top of the current bear leg and are wondering if the bear trend of last week will resume down.
Today is Friday so weekly support and resistance is important, especially at the end of the day. The only nearby targets are yesterday’s high, which is the high of the week, last week’s close of 2046.25, and this week’s open of 2038.25.
Summary of today’s price action and what to expect tomorrow
The Emini reversed down from above yesterday’s high, and it then reversed up from a parabolic wedge bottom just below yesterday’s low.
The Emini sold off strongly on the open to just below the open of the week, which means that the selloff was simply a sell vacuum test of weekly support. It reversed up from a parabolic wedge bottom and then spent 3 hours around the open of the week at 2038.25.
A rally in the final hour failed and became a 2nd leg trap in a 5 hour trading range. The week ended near the open and created a doji candle on the weekly chart.
See the weekly update for a discussion of the weekly chart and for what to expect going into next week.
Traders can see the end of the day bar-by-bar price action report by signing up for free at BrooksPriceAction.com. I talk about the detailed Emini price action real-time throughout the day in the BrooksPriceAction.com trading room, and a 2 day free trial is available.
When I mention time, it is USA Pacific Standard Time (the Emini day session opens at 6:30 am PST, and closes at 1:15 pm PST). You can read background information on the intraday market reports on the Intraday Market Update page.


