Emini island bottom bull breakout
Updated 6:46 a.m.
While the Emini gapped up to a new high and formed an island bottom, the breakout was weak. The Emini is Always In Long, and the bulls still want a bull trend day. Yet, these 1st few bars make a strong bull trend day less likely. More likely, if the bulls get an early rally, it will probably lead to a trading range.
Because the context is good for the bulls, traders have to be ready for a bull trend day. When there is early trading range trading like this, the bulls are often able to create a Small Pullback Bull Trend Day. That typically has a weak rally, but it forms gaps and the pullbacks are small. If that begins to happen, traders will swing longs.
The bears need to close the gap. If so, traders would see today as a double top with last week’s all-time high. Furthermore, they need consecutive big bear trend bars. Without that, any selloff would probably be a bear leg in a trading range day. A bear trend day is unlikely at this point.
Pre-Open Market Analysis
While the Emini has been in tight trading ranges for 2 months, there is no top yet. Furthermore, there are still magnets above that are pulling the chart up. The odds favor a test of 2200 – 2220 before there is a 50 – 100 point pullback. Yet, the chart is close enough to the magnets so that a reversal down can begin with a single big bear trend bar.
If one comes, it could close below the lows of the past 20 or 30 bars. Hence, all of the traders who bought since June would suddenly be holding losing positions. Furthermore, they are aware of how climactic the rally has been. As a result, they would be eager to get out. As a result, the Emini could quickly trade down to below the 2100 top of the 2 year trading range. Because the monthly and weekly charts have been so bullish for 7 months, the odds are that bulls will buy the reversal. As strong as it might be, it will still probably only be a bull flag on the monthly chart.
Tight Trading Ranges, but slightly more bullish
The daily chart has had 4 consecutive bull trend bars closing near their highs. While August has been in a tight trading range, it is above the moving average. This new buying pressure increases the chances of a bull breakout.
The 60 minute chart had a strong reversal up on August 17. While the bears see the trading range since then as a Lower High Major Trend Reversal, the bulls see it as a bull flag. The odds favor a 2nd leg up. A Leg 1 = Leg 2 Measured Move up would reach the 2200 resistance.
Emini Globex session and an island bottom
The Emini is up 6 points. If it opens here, it will gap above the past 5 days. Hence, they will form an island bottom. That will therefore reverse last week’s island top. Furthermore, it would increase the odds of a new high. The first target is a Measured Move up based on the 20 point height of the 5 day island bottom. As a result, the Emini would test above 2200.
Because so many days over the past 2 months have been trading ranges, the odds are that today will also have a lot of trading range trading. Yet, the context is good for a bull breakout. The odds of a bull trend day are therefore higher today.
Traders always have to be aware of the opposite. While it is less likely, the bears might win. They could reverse the Emini down and close the gap. Furthermore, because the Emini is at resistance, today could be a bear trend day. Many days have started with an early selloff. If there is a strong early selloff lasting many bars, the bears might be successful. At the moment, the odds favor the bulls today.
Forex: Best trading strategies
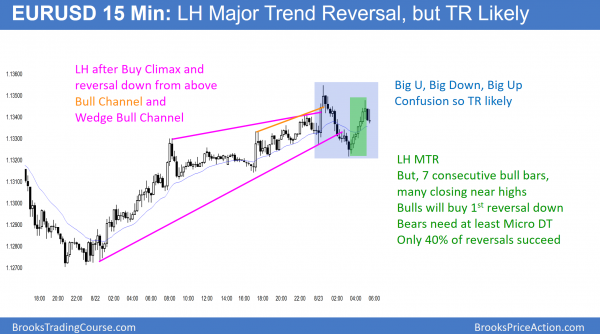
The EURUSD 15 minute Forex chart broke below the bull trend line and is forming a Lower High. This is a Major Trend Reversal. Yet, there are 7 consecutive bull trend bars and most closed near their high. This is a sign of strong bulls. While the Wedge Top Buy Climax will probably lead to 2 legs sideways to down, Major Reversals only have a 40% chance of actually leading to a reversal. Most evolve into trading ranges. That is likely here.
Since the bull micro channel was strong, the bears will probably need at least a Micro Double Top before the 2nd leg down from the Wedge Top can begin. While it is possible that the overnight rally continues above the Wedge top, the odds of a successful breakout and a Measured Move up are only 40%. There is a 60% chance that the bull breakout would fail because the EURUSD chart is near the top of a 3 month trading range. If it does fail, it would probably create a Higher High Major Trend Reversal on the 15 minute chart.
Because bears will sell a rally and bulls will buy a selloff, and neither will hold for a swing, the chart will probably enter a trading range for a couple of days.
I wrote yesterday that the August rally on the daily chart was strong enough so that bulls would buy the 1st reversal down. Because of several sideways bars, traders saw the momentum up as waning. Although yesterday was a buy signal bar, today so far has been a weak entry bar. This is consistent with the trading range needing at least a couple more bars. As a result, the odds are that the daily chart will be sideways again today and probably tomorrow.
Summary of today’s S&P Emini futures price action and what to expect tomorrow
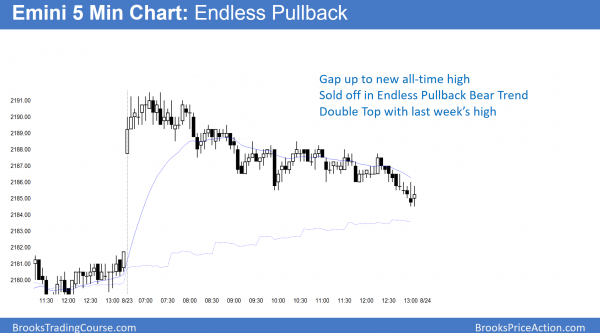
I had to leave early today. The Emini gapped up and created a 5 day island bottom. Yet, there was no enthusiasm. This increases the chances that today’s new all-time high will form a double top with last week’s high. Today was an Endless Pullback bear trend.
After gapping up, the Emini broke to a new all-time high. It then sold off in an endless pullback bear trend. Yet, the selling lack momentum. Today was another small trading range day.
While there is still room to the targets above, the bears want today to form a double top with last week’s high. Because the buyers are mostly momentum bulls, they will be quick to get out on an reversal down. After 2 months in a tight trading range, a 20 point selloff might be all the bears need to begin a 3 week pullback.
See the weekly update for a discussion of the price action on the weekly candlestick chart and for what to expect going into next week.
Traders can see the end of the day bar-by-bar price action report by signing up for free at BrooksPriceAction.com. I talk about the detailed S&P Emini futures price action real-time throughout the day in the BrooksPriceAction.com trading room. We offer a 2 day free trial.
When I mention time, it is USA Pacific Standard Time (the Emini day session opens at 6:30 am PST, and closes at 1:15 pm PST). You can read background information on the intraday market reports on the Intraday Market Update page.


