Emini gap up means possible gap down and island top
Updated 6:47 a.m.
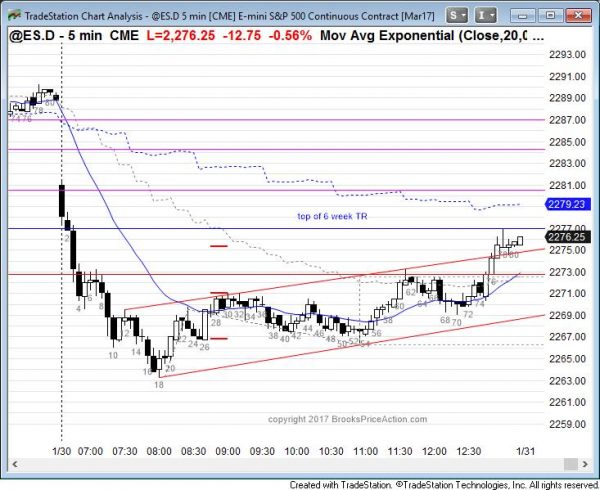
The Emini gapped down and had a big bear trend bar and strong follow-through selling. Hence, the Emini is Always In Short. Yet, it is also a breakout test of the top of the 6 week trading range and a 50% pullback. Furthermore, it is far below the moving average.
While this could become a big bear trend day, it more likely will lead to confusion and a trading range for the next hour or two. Traders will look to sell a rally to near the moving average. There is a 60% chance that the 1st bar will remain the high of the day. The odds are against a bull trend day. Most likely, there will be at least one more leg down, even if there is a bull channel for an hour or two.
Pre-Open Market Analysis
The Emini broke above a 6 week trading range last week. Since the breakout was late in a bull trend, there is an increased risk that it will fail. Therefore, bulls this week want to see follow-through buying. Because the Emini usually goes sideways for several days after a gap up, the bulls are confident that this is a bull flag. Hence, they know the odds favor at least slightly higher prices.
But, when there is a gap up late in a bull trend, traders watch for a gap down at any point in the next several weeks. If there is one, the bars between the two gaps form an island top. Because most tops lead to trading ranges and not bear trends, the downside is usually not great. Yet, the gap down is a sign of strong bears. It therefore increases the chances of a reversal down.
Wednesday’s FOMC announcement
There is uncertainty going into Wednesday’s FOMC meeting. Hence, the Emini might be sideways until then. However, the meeting will probably lead to a big move up or down.
Yet, Wednesday’s FOMC announcement has the potential to be a big surprise. This is because the bond market probably will trade down for the next 20 years after a clear nested wedge top on the monthly chart.
There is a consensus that this is not true. The odds are that it is true. Once traders decide that the Fed will increase rates faster and more often than what now appears to be the case, stock prices will have to adjust down.
However, until there is a strong bear breakout, the odds still favor higher prices. Wednesday has the potential to be a big trend day up or down. While there are targets between 2340 and 2375 above, the Emini will probably not get above them without first testing the 1800 2 year trading range low. However, the odds are that it will test below 1800 at some point over the next 3 years. Therefore, one of these new highs will be the last. Since trends resist change, the odds that any one new high will be the last are small. Hence, until there is a clear strong bear reversal, the odds still favor the bulls.
Overnight Emini Globex trading
The Emini is down 5 points in the Globex session. If it opens here, it would therefore gap down. Hence, the Emini would have a 3 day island top. While this increases the chances of a selloff to the bottom of the December range and the top of the August range, the odds still favor the bulls.
When there is an island top, there is about a 50% chance of trend resumption up. Hence, an island top often leads to an island bottom. The odds are that any move before Wednesday’s announcement will be small compared to the move after the announcement. Hence, while a gap down is bearish, the bears will probably be disappointed by any selling today.
The odds favor uncertainty before the FOMC report. Since uncertainty is a hallmark of a trading range, the odds are against a big move today. Yet, the potential for a major top is real. If the Emini begins to selloff, traders should be prepared to swing trade at least part of their position. A big bull trend day is less likely.
EURUSD Forex Market Trading Strategies
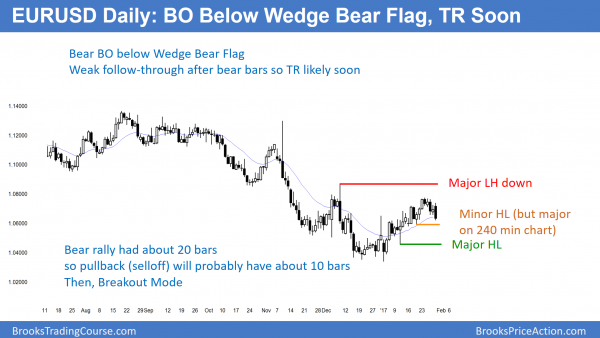
The daily EURUSD Forex chart has been in a trading range for 3 months. While it has sold off for 5 days below a wedge bear channel, each of the 3 bear bars led to a bull bar. Targets are the higher lows below.
The EURUSD daily chart failed to break above the December 8 major low high. It has sold off below the wedge bear flag for the past 5 days. Traders therefore expect a test of support. Hence, the January 19 higher low of 1.0588 is the next target.
Since wedge bear channels usually correct down in about half as many bars as they rallied, this selloff will probably last about 2 weeks. Furthermore, wedge channels usually evolve into trading ranges. Therefore, the odds are that the selloff will bounce at a major higher low, like the January 11 low of 1.0453. In addition, a wedge rally has 2 sided trading. It the selloff therefore usually leads to a trading range. Hence, the daily EURUSD daily chart is probably in a bear leg of what will become a trading range over the next month.
Wednesday’s FOMC announcement
Wednesday’s FOMC announcement has the potential to be a big surprise. This is because there is a consensus that the Fed will raise rates slowly, and this is probably wrong. Since the monthly bond market has a clear major top, interest rates will probably rise for the next 20 years. Yet, no one talks about this. Once traders discover this, and they will at some point in the next year or two, the dollar will strengthen. Therefore, the EURUSD will probably get down to par (1.0000), and possibly lower.
Because of Wednesday’s uncertainty, the EURUSD will probably enter a narrow range until the announcement. This is consistent with what the chart appears to be doing.
Overnight EURUSD Forex trading
The EURUSD Forex market sold off more than 100 pips overnight. Because the month long rally had bar follow-through buying on the way up and this selloff on the daily chart lacked strong follow-through selling on the way down, the odds are that this is a bear leg in what will be a trading range for the next month. Yet, the overnight selling was strong enough so that the best the bulls will probably get today is a trading range.
Because this selloff is probably part of a trading range on the 240 minute and daily charts, traders will buy breakouts below prior lows. Hence, there will be some buying here below Thursday’s low. Yet, the momentum down overnight was strong. Therefore the buying will probably halt the overnight selling, but not reverse the market into a bull trend.
Summary of today’s S&P Emini futures price action and what to expect tomorrow
The Emini gapped down and therefore created a 3 day island top. It sold off in a series of consecutive sell climaxes, but reversed up from a wedge bottom. A double bottom higher low major trend reversal led to a swing up at the end of the day.
The bulls saw today as another test of the daily moving average. They will try to close the gap tomorrow or after Wednesday’s FOMC announcement. The Emini is in breakout mode. While the bears have an island top, the bears were unable to close the day near its low. Hence, the bears failed again to get a close below the daily moving average.
Despite the gap down, there has been only one close below the average price in about 70 days. Therefore, the odds still favor higher prices. Yet, the probability will be barely better than 50% going into Wednesday’s report. Traders should be open to a big move up or down, or multiple reversals.
Tomorrow is the last day of the month, but there are no significant monthly magnets this month.
See the weekly update for a discussion of the price action on the weekly candlestick chart and for what to expect going into next week.
Traders can see the end of the day bar-by-bar price action report by signing up for free at BrooksPriceAction.com. I talk about the detailed S&P Emini futures price action real-time throughout the day in the BrooksPriceAction.com trading room. We offer a 2 day free trial.
When I mention time, it is USA Pacific Standard Time (the Emini day session opens at 6:30 am PST, and closes at 1:15 pm PST). You can read background information on the intraday market reports on the Intraday Market Update page.


Al,
Are you in or out of the market before a FOMC announcement? Wondering your approach.
Thank you-Richard
Allow me to answer this on Al’s behalf. He’s typically not in any trades (at least not the e-mini futures) before an FOMC report. Usually he also suggests for traders not to enter any trade until 2 or more bars after the report (11:10AM and later).
Hi Al, would you think the 23 signal bar short ending up as a 4 tick failure is a possible reason for the 26 spike?
Thanks.