Emini exhaustion gap and possible buy climax island top
Updated 6:46 a.m.
Despite Friday’s strong bull close, the Emini reversed down after testing Friday’s high. Since Friday’s rally was strong, this is probably a Big Up, Big Down, Big Confusion open. Hence, the Emini will probably go sideways around a 50% pullback from Friday’s rally. Furthermore, the 60 minute moving average and Friday’s trading range high are just below. They are support and therefore reduce the chance of strong bear open.
Since today opened just below Friday’s high instead of above, the bulls are not as strong as they could have been. This therefore looks like a neutral open. Hence, it increases the chances of a 1 – 2 hour early trading range. Furthermore, it reduces the chances of a strong trend day up or down today.
Pre-Open Market Analysis
This is the final 2 days of the month, which has been strongly bullish. Yet, the ii from 2 weeks ago probably was the start of a trading range. Furthermore, the trading range will probably test down to the bottom of the ii. That is the February 16 low of 2336.75. Hence, the odds are that last week’s gap up will close and become an exhaustion gap. In addition, a gap down today or this week will create an island top.
Because a trading range is likely this week, the 5 minute chart is probably going to have more trading range price action as well.
Fed interest rates hike at the March 15 FOMC meeting?
The March 15 FOMC meeting is especially important because the odds are that the Fed will begin raising interest rates for the next many years. That will signal a major change. Since part of the rally is because of the low cost of capital, an increase in that cost could cause a repricing of the stock market.
Although that will probably happen, it might take years to unfold. An obvious target is the 1800 bottom of the 2 year trading range and then a test down to the 1500 double top on the monthly chart.
Overnight Emini Globex trading
While the Emini traded above last week’s high overnight, it is now down about 1 point. The bulls are hoping for a 3rd consecutive gap up on the weekly chart. I don’t ever remember seeing that in the 17 years of the Emini’s existence, nor in 30 years of trading S&P and Emini futures. Therefore it is unlikely. In addition, if there is a gap up, it will likely close before the end of the week.
Since the Emini is far above the daily and weekly moving averages, it will probably not rally much until it gets closer to the average price. This can happen by going sideways or down. For over a week, I have been saying that the Emini will probably be mostly sideways.
This is because the odds of a big selloff are small after such a strong rally without the bears creating some selling pressure. The typically need a trading range to halt the rally and create that selling pressure. Hence, the Emini will probably be mostly sideways into the FOMC meeting. When the daily chart is in a trading range, the 5 minute chart usually has a lot of trading range price action.
EURUSD Forex Market Trading Strategies
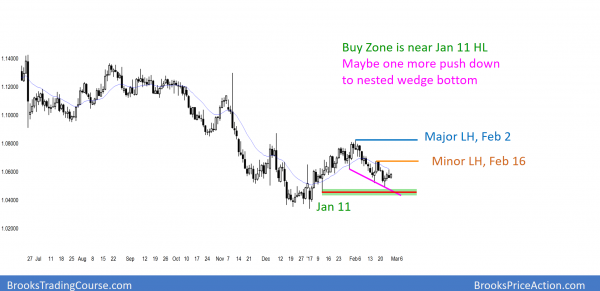
The EURUSD daily chart is struggling to rally because it has not fully tested a nearby support level.
Because the EURUSD is near major support, there is a strong magnetic pull just below. Hence, it is difficult for the bulls to break free from the magnet without first getting very close to it or below it. This is because when a market is in a trading range and near support, traders know that the market usually has to get extremely close to the support for traders to conclude that the selloff tested the support. Since that has not yet happened, bulls are hesitant to buy for less than a scalp and bears confidently sell rallies.
While it is possible for the bulls to create a strong enough rally for traders to conclude that this is all of the test that the market will have, the odds are against it. Therefore the odds favor one more new low in this 4 week selloff.
Head and Shoulders Bottom on the EURUSD daily char
That January 11 low is the final major high low in the strong rally that began in January. As long as the selloff does not fall more than about 20 pips below that low, the odds still favor a double bottom with that low. Traders will see a reversal up from that level as a possible head and shoulders bottom. If there is a reversal up, the rally will probably test the neck line, which is more than 200 pips above.
Overnight EURUSD Forex trading
The EURUSD Forex market traded in a 30 pip range overnight. Hence, it is deciding whether to test the January higher low before rallying to the February high. That is most likely.
Because the March 15 FOMC meeting is particularly important, the all financial markets might stay mostly sideways until after the announcement. Hence, the odds favor a lot of trading range scalping for the next 2 weeks.
Summary of today’s S&P Emini futures price action and what to expect tomorrow
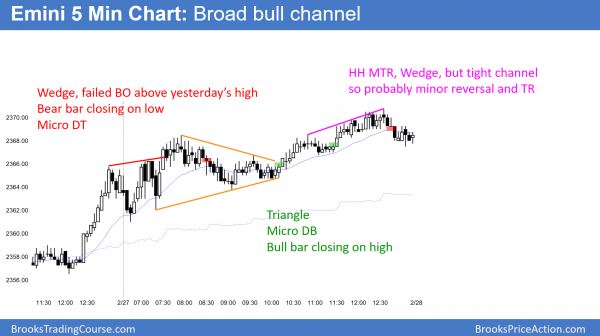
After an weak early rally, the Emini traded sideways for hours, and worked higher to a new all-time high.
While the Emini made a new all-time high, the rally was weak. Although tomorrow is the final trading day of the month, there is no significant nearby monthly support or resistance. Because the Emini had a buy climax and has been sideways for 2 weeks, the odds are that the tight trading range will continue. Since trading ranges usually have a lot of trading range price action on the 5 minute chart, that is what is most likely today.
See the weekly update for a discussion of the price action on the weekly candlestick chart and for what to expect going into next week.
Traders can see the end of the day bar-by-bar price action report by signing up for free at BrooksPriceAction.com. I talk about the detailed S&P Emini futures price action real-time throughout the day in the BrooksPriceAction.com trading room. We offer a 2 day free trial.
When I mention time, it is USA Pacific Standard Time (the Emini day session opens at 6:30 am PST, and closes at 1:15 pm PST). You can read background information on the intraday market reports on the Intraday Market Update page.


Hi Al,
In general how close is market too close to ” major support “, is it difficult for the bulls to break free from the magnet without first getting very close to it or below it?
Is it within ” 4 scalp size ” ? Thank you
As you can imagine, it is relative. On a daily chart, it could easily be 20 pips or more, but on a 5 min chart, it might be 5 pips. Thinking in terms of scalp size makes sense. I suspect less than 2 times the min scalp would be about right.