Emini and Forex Trading Update:
Monday May 24, 2021
Pre-Open market analysis of daily chart
- Double bottom rally and double top since May 12, so Breakout Mode.
- 6-week trading range so Breakout Mode.
- Bulls have slight advantage because yearlong bull trend, and reversal up after a reversal down 2 weeks ago. A 2nd reversal is higher probability.
- Friday is sell signal bar for double top lower high major trend reversal.
- Probably more buyers than sellers below Friday’s low since: the Wednesday/Thursday rally was very strong; it broke above the May 14 high, which is the neckline for the double bottom; and, Friday was not a big bear bar closing near its low.
- On weekly chart, last week is buy signal bar for High 1 bull flag. But it was a perfect doji and therefore a weak buy setup.
- This is the final week of the month. The bulls want May to be the 4th consecutive bull bar. That means they want Friday to close above the open of the month, which could be a magnet all week.
- The bears want a bear bar on the monthly chart, so that May will be a sell signal bar for a parabolic wedge top on the monthly chart. Traders would then be looking for a possible 2-month pullback.
Overnight Emini Globex trading on 5-minute chart
- The Emini is up 20+ points in the Globex session, and just below Friday’s high.
- Today will likely gap up, and if it does, the gap will probably be small. Small gaps typically close in the 1st hour.
- Bulls want breakout above Friday’s high, since Friday is a sell signal bar. That could make the bears give up, which would increase the chance of a bull trend today.
- Daily chart is in Breakout Mode over past 2 weeks, and bulls again trying for bull breakout. Increased chance of bull trend day today.
- Friday broke out above neckline (May 14 high) of the double bottom, but reversed down.
- If the bears get a 2nd reversal down today, Emini will probably pull back for at least a couple days. Traders will watch for reversal down from around Friday’s high and then a bear trend day.
- Odds favor the bulls on the daily chart. They want at least a bull day today, which would increase the chance of a breakout this week, and a test of the May 7 all-time high.
- Middle of 6-week trading range and most days have had at least one reversal. Day traders will expect that again today.
- If series of strong trend bars in either direction in 1st hour, then increased chance of trend day.
Friday’s Emini setups

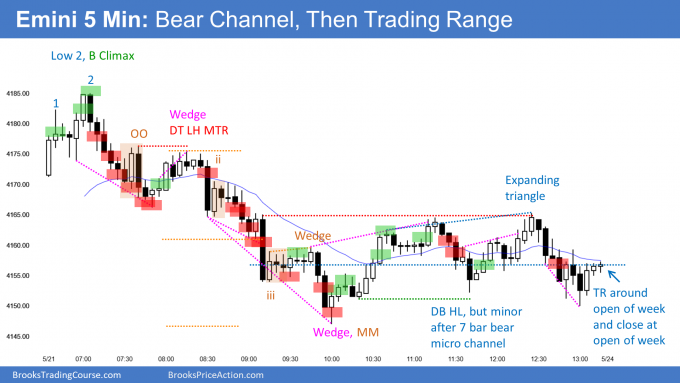
Here are several reasonable stop entry setups from Friday. I show each buy entry with a green rectangle and each sell entry with a red rectangle. Buyers of both the Brooks Trading Course and Encyclopedia of Chart Patterns have access to a much more detailed explanation of the swing trades for each day (see Online Course/BTC Daily Setups).
My goal with these charts is to present an Always In perspective. If a trader was trying to be Always In or nearly Always In a position all day, and he was not currently in the market, these entries would be logical times for him to enter.
If the risk is too big for your account, you should wait for trades with less risk or trade an alternative market like the Micro Emini.
EURUSD Forex market trading strategies
EURUSD Forex daily chart

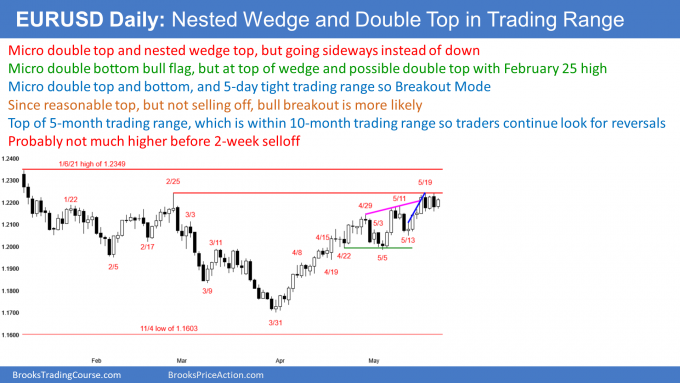
- Friday was an outside down bar.
- It formed a micro double top with Wednesday’s high.
- The rally to May 19 was a nested wedge. Friday is a sell signal bar for the nested wedge and for a double top with the February 25 high.
- When there is a credible sell setup, and the market does not go down, it will probably go up.
- 5-day tight trading range so Breakout Mode.
- Friday closed above Thursdays low, so low probability sell setup. Might be more buyers than sellers below.
- Today so far is a bull inside day. There is a micro double bottom in the 5-day tight trading range. If today is a bull day, it will be a buy signal bar for tomorrow, especially if today closes near its high.
- Strong bull trend since March low, so once there is a reversal down, it will probably be minor. There might be a 2-week sideways to down pullback, but bear trend not likely this week.
- Might test down to 1.20 Big Round Number, since it is also around 50% pullback, and at bottom of wedge.
- Bulls want breakout above January high, which is top of 2-year trading range.
- Most trading range breakouts fail, so probably sellers above or around January high.
- 4-day tight trading range reduces chance of big move up or down today.
Overnight EURUSD Forex trading on 5-minute chart
- EURUSD sold off sharply several hours ago, but reversed up just as sharply.
- Bulls prevented today from trading below yesterday’s low, which would have triggered daily sell signal.
- Reversal up was strong enough to make a bear trend unlikely today.
- Sideways for 2 hours in the top half of the 5-day tight trading range.
- Today will probably be a trading range day, and stay within the 5-day tight trading range.
- If today breaks above Friday’s high and the top of the range, the breakout will probably not be big. Therefore, today will probably not be a big bull day.
- Since sideways to up is likely, day traders will scalp in both directions.
- Trend day up or down is unlikely, but if there is a series of strong trend bars, traders will switch to swing trading.
- The bulls want today to close nears its high, which would increase the chance of a breakout above the February 25 high tomorrow.
- The bears would like today to be a 2nd consecutive bear day, but the odds favor a bull day today. The bears instead will try to get today to close below the midpoint of the range, to continue the 5-day tight trading range and reduce the chance of a bull breakout.
Summary of today’s S&P Emini futures price action and what to expect tomorrow

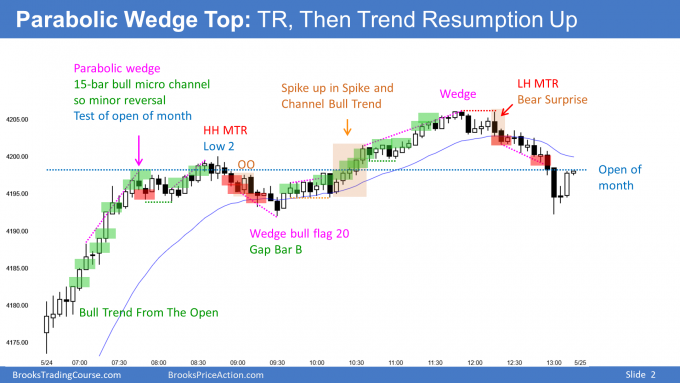
Here are several reasonable stop entry setups for today. I show each buy entry with a green rectangle and each sell entry with a red rectangle. Buyers of both the Brooks Trading Course and Encyclopedia of Chart Patterns have access to a much more detailed explanation of the swing trades for each day (see Online Course/BTC Daily Setups).
My goal with these charts is to present an Always In perspective. If a trader was trying to be Always In or nearly Always In a position all day, and he was not currently in the market, these entries would be logical times for him to enter.
If the risk is too big for your account, you should wait for trades with less risk or trade an alternative market like the Micro Emini.
End of day summary
- Strong bull trend from the open.
- Entered tight trading range around open of month and 4,200 Big Round Number, then trend resumption up.
- Sold off sharply into the close to back below the open of the month, which might be magnet all week.
- Bulls want May to close above open of month on Friday when the month ends. Bears want a bear bar on the monthly chart.
- By going above last week’s high, triggered weekly High 1 buy signal.
- Breaking again above May 14 neckline of double bottom.
- Even though daily chart has been in trading range for 7 weeks, I have been saying that the bulls had a slightly higher probability of a bull breakout. Today increases that probability a little more.
See the weekly update for a discussion of the price action on the weekly chart and for what to expect going into next week.
Trading Room
Traders can see the end of the day bar-by-bar price action report by signing up for free at BrooksPriceAction.com. I talk about the detailed S&P Emini futures price action real-time throughout the day in the BrooksPriceAction.com trading room. We offer a 2 day free trial.
Charts use Pacific Time
When I mention time, it is USA Pacific Time (the Emini day session opens at 6:30 am PT, and closes at 1:15 pm PT). You can read background information on the intraday market reports on the Market Update page.


Hi al
I hope you are well
Could you please tell me how much minimum scalp in Dow Jones ?
Hi Sina, Al is on leave and I do not trade the Dow, but see the following “How to Trade Price Action Manual” article (Members Only access) about sizing of scalps.
Key points are (1) need 2 ticks in any trade to allow for bid/offer difference on entering and exit, (2) calculate how commissions affect losses, and (3) use price action to estimate what traders would be looking for in terms of minimum size.
Extreme scalping — manual high frequency trading (HFT)
Al hey, thanks for the detailed report and above all enjoy your vacation! Question re Gap open, in the pre market you have stated the market will gap-up while open and typically small gaps tend to close by 1st hour. A. how you define small gap point wise? B. in such day that was bull trend from open, which bar you feel comfort to place a buy and stop below the low of the day and having the notion the gap will not be close?
Hi Eli, answering for Al who as you said is enjoying his vacation! : )
I proof and publish Al’s reports and did think about deleting that “small gap” comment as I guessed it might raise a query or two! Yes, it seems that 20 points is not small, but we have had so many wide ranging days I decided to leave it as is. The “small gap” in the context of wide swings is Ok, right?
Ref query on trading comfortably with gaps, Al did mark the second pullback as a trade, entering on bar 6. On detailed Daily Setup chart, it was marked as a good trade for beginners too.
Hope that helps.
Dear Al,
I bought bar 5. I see you marked bar 15 as a sell setup regarding parabolic wedge top. At that time, I still held my position because bar 15 or bar 16 didn’t break bull trend line from 1L to 5L yet. To exit my position, should I exit my position because of parabolic wedge top or wait until it tested 15H after breaking bull trend line?
Thank you.
Hi Vorakan, answering for Al who is now on leave.
Well done taking that trade and holding through the parabolic wedge top reversal. If you see Al’s analysis on the BrooksPriceAction.com website he notes that you could exit below bar 15 if you are concerned with risk, and buy again above bull bar. As you were using a trend line, and not so concerned about risk, you did fine. I too make good use of trend lines.
Given the evident minor reversal I would not be holding for a test of 15H as it would have broke your trendline soon after bar 15. Bar 20 could have been a good time to re-enter keeping a tight stop below trading range. But with exhausted bulls, and sideways action, would not be looking for another big swing trade for some time – the wedge bull flag (bar 37) much later was good for a reasonable swing though.
Hope that helps.
Thank you, Richard.