Trading Update: Wednesday April 20, 2022
Emini pre-open market analysis
Emini daily chart
- Yesterday, the bulls got a strong entry bar following the April 18 second entry buy. They want consecutive bull trend bars on daily chart.
- The bulls are hopeful that this will lead to a rally back up to the March 29 close. March 29 was a reasonable buy the close bar (although climactic). This means there will be scale in bulls looking to exit around the March 29 close, so it is a magnet.
- Bears hope that yesterday is a pullback in what will lead to a second leg down and a breakout below April 18.
- While the odds slightly favor a test back to the March 29 close, the market is in the middle of the February – April trading range, which means the probability has to be close to 50% for both the bulls and bears.
- The bulls hope today will lead to consecutive bull trend bars, which would increase the odds of higher prices and a test of the March 29 close.
- The bears are hopeful today will be a disappointing bar for the bulls and a reminder that the market will likely remain in a trading range.
Emini 5-minute chart and what to expect today
- Emini is up 40 points in the overnight Globex session.
- The Globex market got a breakout above a trading range around 2:00 AM PT and has been in a bull trend since.
- The bulls will try hard to get strong follow-through again today, which would increase the odds that the market is going to test the March 29 close.
- Traders should be open to the possibility of another trend from the open. However, if today is a bull trend day, it will probably not be as clear as yesterday.
- Instead, today might be a trending trading range day or small pullback bull trend day that is not clearly always in. However, it slowly drifts up all day.
- As usual, traders should expect a limit order market on the open. If one is uncomfortable trading in a trading range, they should consider waiting for 6-12 bars looking for a credible swing trade or a strong bull breakout with follow-though.
- If today is going to be a strong trend day like yesterday, there will be plenty of time to enter. Look at yesterday and notice how many opportunities traders had to buy as long as they were willing to use an appropriate stop.
Yesterday’s Emini setups

Al created the SP500 Emini charts.
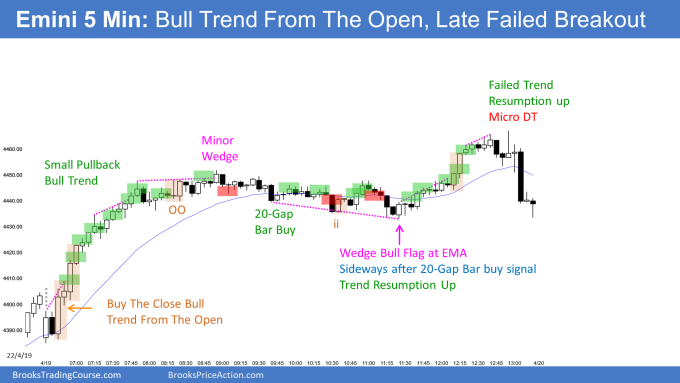
Here are several reasonable stop entry setups from yesterday. I show each buy entry with a green rectangle and each sell entry with a red rectangle. Buyers of both the Brooks Trading Course and Encyclopedia of Chart Patterns have access to a much more detailed explanation of the swing trades for each day (see Online Course/BTC Daily Setups).
My goal with these charts is to present an Always In perspective. If a trader was trying to be Always In or nearly Always In a position all day, and he was not currently in the market, these entries would be logical times for him to enter. These therefore are swing entries.
It is important to understand that most swing setups do not lead to swing trades. As soon as traders are disappointed, many exit. Those who exit prefer to get out with a small profit (scalp), but often have to exit with a small loss.
If the risk is too big for your account, you should wait for trades with less risk or trade an alternative market like the Micro Emini.
EURUSD Forex market trading strategies
EURUSD Forex daily chart

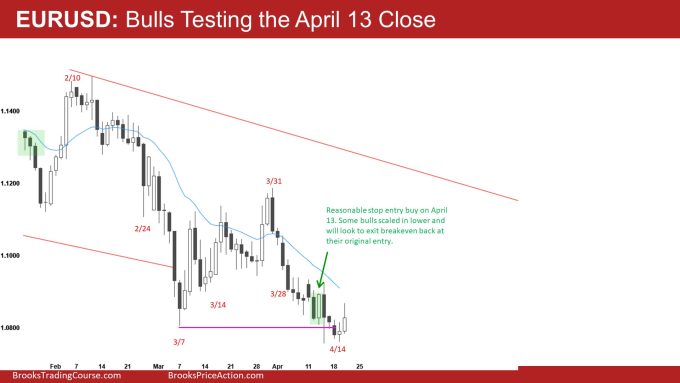
- The bulls are trying to get back to the April 13 stop entry. April 13 was a reasonable stop entry in a trading range. Some bulls who took the stop entry buy bought more below April 13 and will look to exit back around their original entry price. Some traders would be disappointed enough to get out several pips below their first entry, which is one reason why today’s bar has a big tail.
- Yesterday was a second entry buy for the failed breakout below the March 7 low. Some bulls bought the close of yesterday (April 19). Most of the bulls that bought scalped out, and bears sold, which is another reason the market sold off back to the high of April 19.
- Today is a problem for the bears. Although today’s bull bar is currently weak, it will make it difficult for bears to be willing to stay short, betting on a successful bear breakout below the March 7 low.
- The odds are that the EURUSD will test back to the middle of the March – April range and ultimately reach the March high. Traders still do not know if this is the start of the test of the March high or if the market has to go sideways first.
Summary of today’s S&P Emini futures price action and what to expect tomorrow
- Al will post chart after the close.

Al created the SP500 Emini charts.
End of day summary
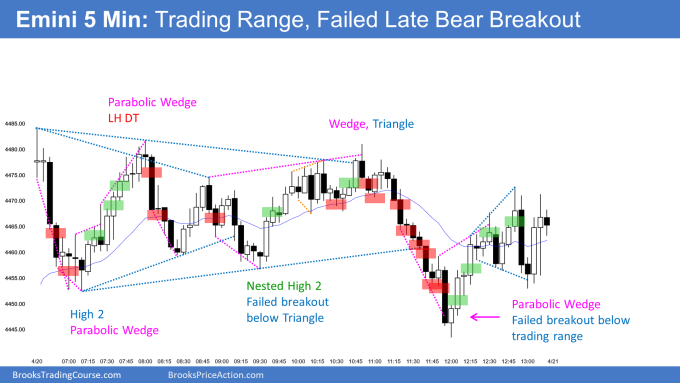
- The bulls got a gap up on the open and two consecutive bear trend bars testing the moving average. The bears ended up getting a small second leg down, lasting two bars and a reversal back up to the open of the day.
- By 8:00 PT, the market had a big down, followed by a big up, so a trading range was most likely.
- Traders were fading the rallies up to the top one-third of the range and fading selloffs to the bottom one-third of the range.
- The bears got a wedge top around 10:45, which led to a strong selloff and low of the day. However, the selloff down to 12:00 PT was climactic.
- After the parabolic wedge bottom around 12:00 PT, most bears would exit. As strong as the bears were, they only had one big bear bar breaking below the day’s range, which increased the odds of the bear breakout failing.
- Overall, today was a trading range day. It is important to notice how almost every breakout bar was followed by lousy follow-though. Compare today to yesterday’s trend from the open and see how yesterday had several strong consecutive trend bars closing far above the previous day’s range. Today while there were consecutive trend bars, they did not break out of anything. Are were results of a vacuum test of support, such as the late selloff down to 12:00 PT.
See the weekly update for a discussion of the price action on the weekly chart and for what to expect going into next week.
Trading Room
Traders can see the end of the day bar-by-bar price action report by signing up for free at BrooksPriceAction.com. Al talks about the detailed S&P Emini futures price action real-time throughout the day in the BrooksPriceAction.com on trading room days. We offer a 2 day free trial.
Charts use Pacific Time
When times are mentioned, it is USA Pacific Time. The Emini day session charts begin at 6:30 am PT and end at 1:15 pm PT which is 15 minutes after the NYSE closes. You can read background information on the market reports on the Market Update page.

