Emini buy climaxes, awaiting FOMC and unemployment report
Updated 6:46 a.m.
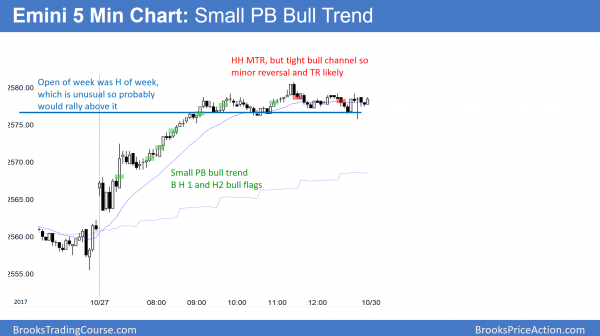
The Emini opened at a 50% pullback from Friday’s rally and began with consecutive bull bars. This reduces the chance of a bear trend day. Furthermore, the 60 minute moving average is support below today’s open. The odds are that today will be either a weak bull day or a trading range day.
The bulls want a 2nd leg up after Friday’s rally. But, Friday went sideways for 4 hours, and therefore the odds are that the trading range will be resistance. Consequently, while the bulls got a strong open, they need to break strongly above that resistance. More likely, the Emini will go sideways in the middle of Friday’s range or in its 4 hour trading range for an hour or more before it decides on the direction of its 1st swing.
Pre-Open market analysis
The Emini’s weekly chart last week went outside down and then outside up. Yet, the body was small and the week was a doji bar, which is neutral. In addition, one of the forces behind last week’s reversal up was that last Monday’s open remain the high of the week for most of the week. Since bars on any time frame only rarely have a high that is exactly at the open, one of the forces behind the reversal back up was an attempt to get above Monday’s high and open, and make the weekly bar like 99.9% of all weekly bars. This reduces the bullishness of the rally.
Friday was a strong bull day and a breakout above a 2 week range. The bulls want follow-through buying today to confirm the breakout and increase the odds of a measured move up. The bears want the breakout to fail. One sign of that would be a bear bar today for the follow-through day. Consequently, today is an information day. If the bulls get a bull body, it would increase the odds of higher prices this week.
There are extreme buy climaxes on the daily, weekly, and monthly charts. But, until the bears get a strong reversal down with follow-through selling, the odds continue to favor at least slightly higher prices.
Wednesday’s FOMC meeting and Friday’s unemployment report are both catalysts. In addition, last week was a doji bar, which is a one bar trading range. Therefore this week might be sideways into those 2 announcements.
Overnight Emini Globex trading
The Emini is down 5 points in the Globex market. Since last week was a doji bar, there is an increased chance of more trading range trading this week. In addition, last week had a big range and it was an outside up week. That therefore increases the chances that this week will be an inside week, or that it will not get far above last week’s high. Since today will open near last week’s high, traders should watch for sell setups around last week’s high.
Since Friday was a buy climax, there is only a 25% chance that today will be a big bull day. Friday was in a tight range for its final 4 hours and it therefore ended in breakout mode. The bulls want trend resumption up and the bears want a major trend reversal down. Since there is no clear top, the bears will probably need at a major trend reversal to get a reasonable chance of a bear trend day today. Consequently, bulls will probably buy the 1st selloff.
Friday’s setups
Here are several reasonable stop entry setups from Friday. I sometimes also show limit order entries and entries on the close of bars.
EURUSD Forex market trading strategies
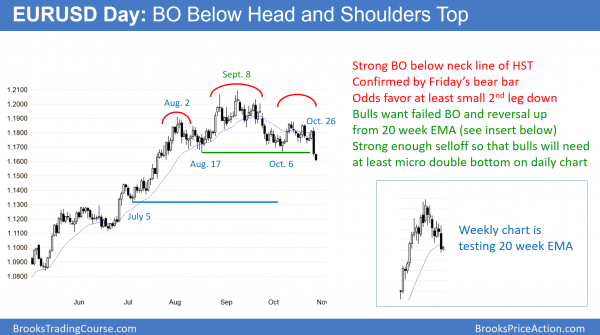
Friday’s bear body on the daily EURUSD Forex chart confirmed the breakout below the neck line of the head and shoulders top. This increases the chances of at least a small 2nd leg down. However, the weekly chart is pulling back to its 20 week exponential moving average for the 1st time in over 20 weeks. That is a 20 Gap Bar buy setup.
The bears got their break below the neck line of the 3 month head and shoulders top on the daily chart. All major trend reversals have a 40% chance of growing into a bear trend. Thursday’s selloff and Friday’s follow-through selling makes at least a small 2nd leg down likely. In addition, the bulls will probably need at least a small double bottom before they can reverse the breakout back up into the 3 month range.
On the weekly chart, there has been a gap below the low of every bar and the moving average for more than 20 weeks. This therefore means that the bulls have been eager to buy, even far above the average price. They now finally are getting an opportunity to buy at the average price.
Weekly bulls and daily bears are both strong
However, the 2 month selloff has been in a tight bear channel and last week was a big bear bar. Consequently, the bulls need to first stop the selling before they have a reasonable chance of a resumption of the bull trend. This means that the bulls will need at least 2 – 3 sideways weeks before they can regain control. However, since the weekly chart is now at support in a strong bull trend on the weekly chart, the odds are against continued strong selling over the next couple of weeks.
The weekly chart is still in a bull trend and the 2 month selloff is still a potential High 2 bull flag at support. Yet, the daily chart sold off strongly last week. These are conflicting forces. As a result, this week will probably go sideways and form a small trading range. The bulls want a micro double bottom and a reversal back up into the 3 month range. The bears will see the small range as a double top bear flag below the moving average. They therefore will expect at least a small 2nd leg down over the next few weeks.
While the weekly moving average is strong support in the strong bull trend on the weekly chart, the 2 month selloff on the weekly chart is in a tight bear channel. As a result, the odds favor at least another 100 – 200 pips lower before the bulls have a reasonable chance at regaining control. Furthermore, rallies in the 2015 trading range failed around 1.1400. Consequently, this is support and therefore a magnet below.
Overnight EURUSD Forex trading
The 5 minute EURUSD Globex chart rallied 40 pips overnight. However, this is tiny compared to last week’s 250 pip collapse and therefore a minor reversal on the 240 minute chart. Yet, it is at the weekly moving average and therefore at support. The odds are it is the 1st sign that the selling is weakening and that a trading range might soon begin.. Bears will continue to sell rallies for swings and scalps, but know that the odds are the last week’s sell climax will lead to several sideways day’s this week. Therefore, bulls will begin to buy selloffs for scalps. The odds favor a test down to the 1.1400 area over the next month. Unless the bulls get a very strong reversal, it will be easier to make money by focusing on selling rallies than buying reversals.
Summary of today’s S&P Emini futures price action and what to expect tomorrow
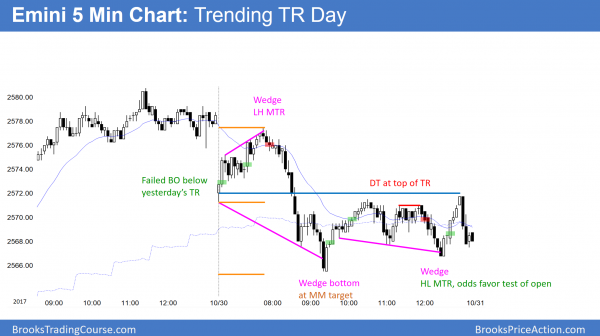
The Emini sold off from a wedge rally on the open. It was also a lower high major trend reversal. It reversed up from a wedge bottom, but sold off after testing the open of the day and the top of the lower trading range.
The Emini pulled back from Friday’s rally. Since last week had a big range and the odds of an inside bar on the weekly chart are higher. Furthermore, if this week goes above last week’s high, it will probably not get far above.
Because today is a bear inside day after Friday’s new high, it is a sell signal bar for tomorrow.
See the weekly update for a discussion of the price action on the weekly candlestick chart and for what to expect going into next week.
Traders can see the end of the day bar-by-bar price action report by signing up for free at BrooksPriceAction.com. I talk about the detailed S&P Emini futures price action real-time throughout the day in the BrooksPriceAction.com trading room. We offer a 2 day free trial.
When I mention time, it is USA Pacific Standard Time (the Emini day session opens at 6:30 am PST, and closes at 1:15 pm PST). You can read background information on the intraday market reports on the Intraday Market Update page.


It`s technical question, where I see 2 very similar trades.
And I would like to know, if I can learn to add sth more to distinguish between them, which is part of learning curve for all of us.
I am sure Al can decide himself not to answer, if he has no time to spare.
I can answer it for you.
“bar 11 L2 at MA, 5 tics BO failure at MA 10/30/2017 (you did not mark as a sell signal)”
Strong Bar 10 so bulls will buy the first pullback expecting at least a small leg up after the potential double top 3,5 failed.
bar 4 L2, 2nd leg MM, 5 tics failure 10/26/2017 (you marked as a sell signal).
Bar 4 was a 2nd entry sell signal and a logical swing entry for a potential high of the day. It was also a pullback to the beginning of the channel that began 10/25 and a test of the breakout below the low of 10/24.
The 5 tick failure was irrelevant; it’s all based on context.
just to comment 5 tick failure
It is not irrelevant. Of course context is more important, but when you have good bull bar as we did on 10/26/17 and bulls could not get scalp PT it more likely increased pressure on selling as they covered long
It`s important not to confuse context: L2 which would be apple and 5 tics, which would be only skin of apple.
thank you Alan,
good point, DT failure followed by bull strength will be the answer.
Hi Al.
bar 11 L2 at MA, 5 tics BO failure at MA 10/30/2017 (you did not mark as a sell signal)
and
bar 4 L2, 2nd leg MM, 5 tics failure 10/26/2017 (you marked as a sell signal).
I know there are 1000 reasons to take or not to take trades, but it feels like picking cherries after applying context + mechanical trading, when beginner trader does not have experience to see small differences between these 2 trades.
Can you please comment.
thx
Hi Jiri,
With Al trying to complete the course update, is it really his best use of time to be trying to explain subtle differences between two trades? Like everyone, Al only has a finite number of hours each day, and I’m sure he is already stretched thin.
Perhaps if these two trades are of importance to you, why don’t you post what you believe to be the differences and perhaps others would comment.
Have a good day.
I think we should all be VERY grateful Al takes the time each day to mark these trades, and leave it at that.
If people keep asking him to explain what is marked or not marked. Al may just decide that it’s taking up too much of his time, and just stop marking the trades.
Is that way anyone wants to see happen? Of course not.
by the way Alan, your attitude towards somebody who seeks answers
is pretty poor and I do not believe it reflects Al Brooks attitude
who is willing to try help other traders. Good job you are not Al Brook as no one would get nowhere.
so next time keep your comments to yourself unless they are technical.
Saying that your answer was spot on and helped me so thank you.
Just for somebody who seeks helps, do not be afraid to ask, if you are seeking progress. Alan is not true mirror of this community.