Emini buy climax testing all time high and maybe 2500
Updated 6:52 a.m.
The Emini opened with a bull doji bar within yesterday’s range. This open is similar to yesterday. Hence it increases the odds of a lot of trading range trading again today. However, the magnet of the all-time high is strong. Therefore, there is an increased chance of a trend day up or down. This is true despite the trading range open and the 2 days of quiet trading.
Today began with a trend from the open bull trend. It is therefore Always In Long. However, there is always a risk of a parabolic wedge top and early high of the day when there is a buy vacuum test of resistance like this. This is especially true since the open is a bull break above a 2 day bull channel.
While the Emini began with 4 bull bars, it lacked consecutive big bull bars. That increases the chances of a trading range by the end of the 1st hour, like on Wednesday. At the moment, the Emini is likely to begin to go sideways for an hour or more. Since there is no clear parabolic wedge top yet, the odds of a reversal down over the next few bars is small. The odds of a strong bull trend in the absence of consecutive big bull bars are also not high.
Pre-Open market analysis
Yesterday was another day with mostly trading range price action. Since the Emini is very close to the all-time high, it is within the magnetic field. Therefore, it probably will have to get closer. Both the bulls and bears want to know if the resistance will hold.
Wednesday’s breakout above the 3 week bull flag was strong enough to make a test of the all-time high likely. Yet, the entire rally since March is probably a bull leg in a trading range. Therefore, the Emini will probably test the March low before going much higher.
Since the bears have been unable to create a credible top or a strong reversal down, the rally might continue up to 2500. Whether or not it does, it will probably reverse into a bear leg for a few months before going much high.
The weekly buy climax is extraordinary. While there is no top yet, the odds are against it lasting much longer. Hence, the Emini will go sideways to down to below the weekly moving average before going much higher.
Weekly support and resistance
Today is Friday and therefore weekly support and resistance are important. The most important resistance is the all-time high. There is no significant weekly support within reach today.
Overnight Emini Globex trading
The Emini is up 2 points in the Globex market. If it opens here, it will be within about 3 points of the all-time high. The momentum up is strong enough so that the bulls will probably get a new high. Even if the Emini pulls back for a day or two first, the odds are that this 2 day breakout will have at least one more leg up.
The 2 day rally has been weak. It is therefore probably a bull leg in a trading range. Hence, there will probably be a test of Wednesday’s low within the next few days. That would therefore be a test of Wednesday’s gap up.
The June 19 all-time high of 2451.50 is a strong magnet. Since the Emini is very close, it can accelerate up to that price today. Consequently, there is an increased chance of a strong bull trend day. Yet, because it is important resistance, there is also an increased chance of a reversal down. While more trading range trading is most likely, traders have to be ready for a strong trend day up or down today.
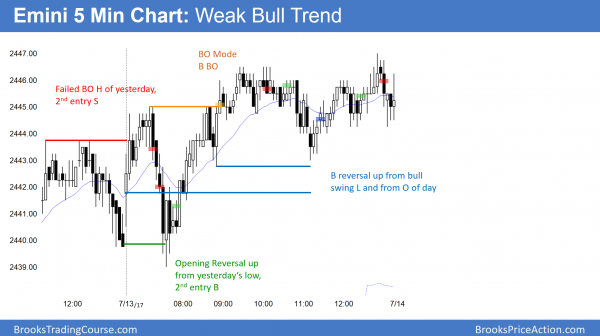
Yesterday’s setups
Here are several reasonable stop entry setups from yesterday. I sometimes also show limit order entries and entries on the close of bars.
EURUSD Forex market trading strategies
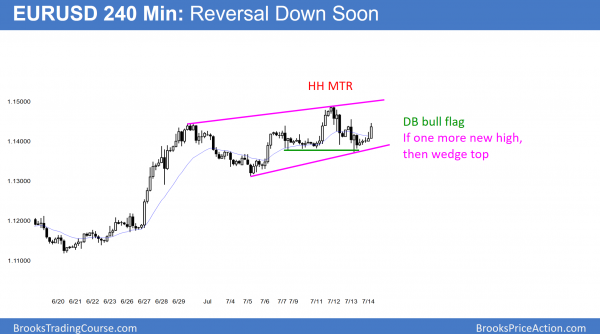
The 240 minute EURUSD Forex chart is in a bull channel. However, it currently has a higher high major trend reversal. It the rally breaks to a new high and stalls bears will sell the wedge top.
The daily EURUSD Forex chart has been in a bull trend for 7 months. Yet, the weekly chart is at the top of a 30 month trading range. The odds, therefore, are that this rally is just a bull leg in that range. Hence, it will probably lead to a bear leg, or at least a small trading range, which should last several months.
The momentum on the daily chart makes a new high likely within the next few days. But, just like traders sold above the June 29 high and created a 120 pip pullback, they will sell above Wednesday’s high. The odds favor another pullback.
A sell signal from above that high would also be a wedge reversal. Because it would be at the top of a 2 year range, the odds are that there would be at least a couple weeks of selling. Furthermore, the selloff would probably test one or both of the higher lows in he wedge. Therefore, it would be 150 – 200 pips.
Top of 30 month trading range
Since the daily chart is in a bull trend, the bulls want the pullback from the breakout to stay above the June 29 high. They would therefore look for a 160 pip measured move up. That would be above the May 2106 high. The EURUSD has only been high once in 30 months (the top of the range is the August 2015 high of 1.17.12).
However, the EURUSD chart has rallied to around 1.1500 many times in the past 30 months. Almost every time led to a trading range lasting a couple of months. That is therefore what is likely this time as well. Traders are simply negotiating over where the top of the range will be. It might have already formed on Wednesday. More likely, there will be at least one more higher high.
Overnight EURUSD Forex trading
The bulls rallied 50 pips over the past hour. The odds favor a break above Wednesday’s high, and then a reversal down from a wedge top.
Yet, Wednesday’s reversal down is already a higher high major trend reversal on the 240 minute chart. Normally, that has a 40% chance of a swing down. However, this rally is strong enough to make a breakout above Wednesday high likely. In addition, the bears will need at least a micro double top on the 60 minute chart to get their reversal. Consequently, the best they will probably get over the next couple of hours is a trading range. Hence, the odds are that today will be either sideways or up.
Summary of today’s S&P Emini futures price action and what to expect tomorrow
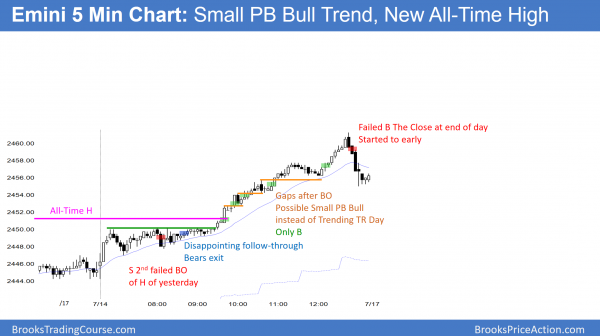
The Emini broke strongly to a new all-time high and had a small pullback bull trend day. The Buy The Close rally at the end started around noon. Since that is too early to last until the close, there was a late reversal down.
Today broke strongly to a new all-time high. In addition, it was the 3rd consecutive bull trend bar after breaking above a 33 week bull flag. The odds are that the bears will need at least a micro double top before they can get a pullback lasting more than a few days. Consequently, the bulls will buy the 1st reversal down next week.
See the weekly update for a discussion of the price action on the weekly candlestick chart and for what to expect going into next week.
Traders can see the end of the day bar-by-bar price action report by signing up for free at BrooksPriceAction.com. I talk about the detailed S&P Emini futures price action real-time throughout the day in the BrooksPriceAction.com trading room. We offer a 2 day free trial.
When I mention time, it is USA Pacific Standard Time (the Emini day session opens at 6:30 am PST, and closes at 1:15 pm PST). You can read background information on the intraday market reports on the Intraday Market Update page.


