Emini buy climax more important than FOMC interest rate hike
Updated 6:45 a.m.
The Emini gapped down, but formed consecutive bull bars on the open. But, unless it rallies strongly above the moving average, the bears will try to form an opening reversal down. They often form a double top or a wedge top.
At the moment, the bears are trying a reversal down on the 3rd bar. However, the 2 consecutive bull bars make an early trading range more likely. Yet, if the bears get a series of strong bear trend bars, they can create a trend from the open bear trend. This early reversal down reduces the chances of a trend from the open bull trend. Hence, the best the bulls will probably get over the next hour is a trading range. The odds favor either a bear trend day or a trading range day.
Pre-Open market analysis
The Emini has been in a tight trading range for 8 days. Yesterday tested the top of the range, which is the all-time high. The daily chart has a parabolic wedge top and a wedge top, and the 4 month rally will probably end up being a bull leg in a trading range. Therefore, the odds favor a test down to the bottom of the range.
In addition, the weekly chart has been above its moving average for 30 weeks. This is the most extreme buy climax in 14 years. While the rally could continue indefinitely, that is unlikely. The odds therefore favor a test down to the weekly moving average beginning soon.
The bulls want the rally to continue up to the next resistance level. That is the 2,500 Big Round Number. While that is only 2% above last week’s high, the extreme buy climax makes a pullback to the weekly moving average more likely first.
Overnight Emini Globex trading
The Emini is down 14 points in the Globex market. Please see my comments over the past weekend about how I think the Emini will follow the pattern of the financial markets over the coming months. The daily chart has a wedge rally since the March low and a parabolic wedge rally since the May low. Finally, the March trading range is probably a Final Bull Flag. Consequently, the odds are that the Emini will sell off about 100 points over the next couple of months to test the March low. In addition, that would finally be a test below the weekly moving average.
Will today be the start of the correction? The context is good for the bears. Hence, the math is good for buying put or put spreads expiring in August or September.
The bears need a strong reversal down to convince traders that the Emini has begun a correction. While a correction is likely soon because of the extreme weekly buy climax, most reversal attempts fail. The bears need one or more strong bear bars on the daily chart before the bulls will give up.
The overnight selloff is testing the bottom of the 2 week trading range. Because today will gap down and there is a possible top, there is an increased chance of a trend day up or down. Since the Emini has had mostly doji bars and trading range days for 2 weeks, the odds are that it will have a trading range open.
The bears will look for a test of the 5 minute moving average and then a bear trend. The bulls will look for a rally up from the bottom of the 2 week range. Furthermore, they will try to close the gap early on. This would therefore weaken the bear case. If instead the bears are able to keep the gap open and reverse any early rally, the odds will favor a bear trend day. Without a strong bear breakout on the daily chart, the odds favor more sideways trading.
Yesterday’s setups
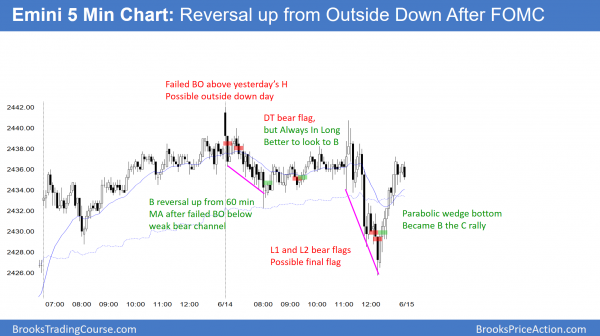
The Emini was sideways into the FOMC announcement. After a parabolic wedge selloff on the report to an outside down day, it reversed up from a 2nd failed breakout below yesterday’s low.
EURUSD Forex market trading strategies
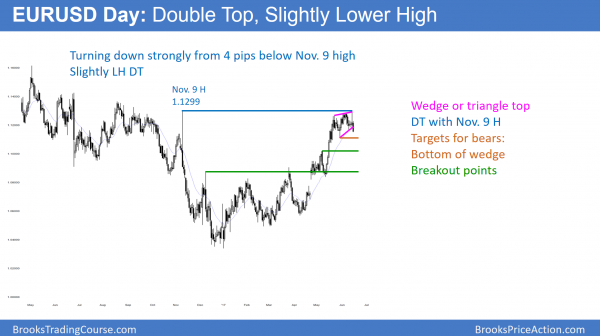
The EURUSD Daily chart got to within 4 pips of the November 9 top of the selloff, and reversed down sharply. The 4 week trading range was a wedge top.
The EURUSD Forex market sold off strongly on November 9. Furthermore, that was another major lower high in a broad bear channel than began 2 years earlier. The channel was very flat and therefore mostly a trading range. However, the bulls need a break above that high to make traders give up on the idea that the daily chart is in a bear channel.
They tried 3 times over the past 4 weeks and failed. The daily chart turned down strongly yesterday after a strong rally that reached up to 4 pips below the November 9 high. That means that yesterday formed a lower high.
The bulls hope that the reversal down will find support either at the bottom of the 4 week wedge trading range, or at the breakout points below. The bears want the selloff to break below the bottom of the 2 year range and then fall to par (1.000).
I have said many times that each of the strong rallies and selloffs is more likely to reverse than lead to a successful breakout of the 2 year range. I also said that while the momentum up over the past 2 months was strong enough to break above the November 9 high, the breakout would probably fail to get above the 2 year range. Eventually, a breakout will succeed. Yet, 80% of strong attempts will fail. Hence, traders should always be ready for a reversal.
Minor reversal more likely than major reversal
At the moment, the odds are that this selloff will last at least a couple of weeks and the bulls will then try again. Therefore, this is more likely a minor reversal. Unless the bears create a series of strong bear bars on the daily chart, the odds are that this reversal down will find support somewhere in the middle of the 2017 rally. However, the reversal down was strong. In addition, it came from just below major resistance, Furthermore, the bears have a reliable topping pattern (a wedge). Hence, the odds favor some follow-through selling for at least a couple of weeks.
Overnight EURUSD Forex trading
The EURUSD sold off 150 pips since yesterday’s high. This is strong momentum down. Hence, it will likely fall more over the next couple of weeks. This is true even if it bounces up from the bottom of the 4 week trading range. Traders will look to sell rallies unless the bulls get an equally strong reversal up. The odds favor a lower high and lower prices.
Because the 5 minute chart had a spike and channel down, which is a climax pattern the odds are that it will begin to enter a trading range today. Yet, even if the rally lasts a couple of days and retraces 50%, the odds favor lower prices. Hence, traders will sell rallies.
Summary of today’s S&P Emini futures price action and what to expect tomorrow
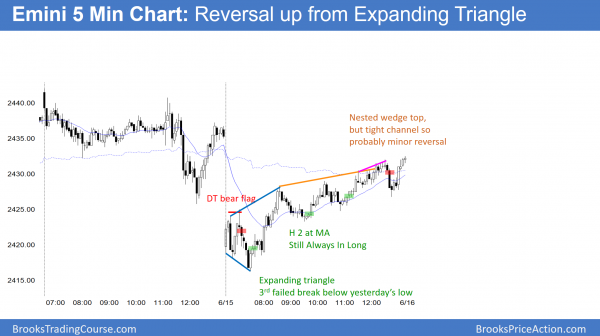
The Emini gapped down, but rallied from a small expanding triangle bottom. It briefly sold off at the end of the day from a Spike and Channel nested wedge rally to the 60 minute moving average. Yet, the bulls bought again, and the day closed on its high.
The Emini reversed up from a gap down, and is still in its 2 week trading range. While the daily chart has a parabolic wedge top and a wedge top, the bulls continue to buy every reversal down. Yet, because the weekly chart is so extremely overbought, the odds favor a 100 point selloff to below the weekly moving average. Furthermore, it will probably begin within the next few weeks.
The reversal up was strong enough so that tomorrow will probably trade above today’s high.
See the weekly update for a discussion of the price action on the weekly candlestick chart and for what to expect going into next week.
Traders can see the end of the day bar-by-bar price action report by signing up for free at BrooksPriceAction.com. I talk about the detailed S&P Emini futures price action real-time throughout the day in the BrooksPriceAction.com trading room. We offer a 2 day free trial.
When I mention time, it is USA Pacific Standard Time (the Emini day session opens at 6:30 am PST, and closes at 1:15 pm PST). You can read background information on the intraday market reports on the Intraday Market Update page.


I agree. Very useful information!
Thanks a lot for providing “Yesterday’s Setups” and also some entry examples on Today’s chart – great and very welcome enhancement to the daily updates.