Emini buy climax and failed breakout to new high
Updated 7:00 a.m.
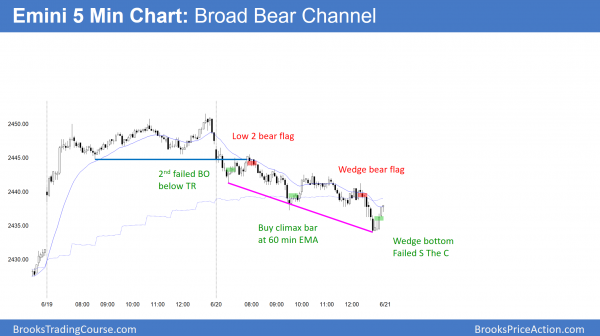
Limit order bulls and bears both made money in the 1st 4 bars. This is an early sign of trading range price action. Furthermore, there were several reversals in the 1st 6 bars. Traders are deciding if the Emini will rally, or selloff and then rally. There is only a 40% chance of a strong break below yesterday’s bear channel and then a strong bear trend day.
Yesterday’s bear channel will probably evolve into a trading range today. Because yesterday was a sell signal bar on the daily chart, traders want to know if there are more buyers or sellers around its low. Since today is likely to reverse much of yesterday’s selloff, the odds are that there will be buyers around yesterday’s low. Yet, the context on the daily and weekly charts is good for the bears. But, they need a strong bear breakout to convince traders that they have taken control on the daily chart.
At the moment, the Emini is Always In Short and testing yesterday’s low. There is a 40% chance of a strong break below the low and the bottom of the bear channel. However, there is a 60% chance of a reversal above the top of the channel today. In addition, that reversal will probably begin in the 1st 2 hours.
While there is no clear bottom yet, the odds favor a rally starting within the 1st 2 hours. Since a 2 day trading range is likely, and the early trading is sideways, the odds are against a strong trend day up or down.
Pre-Open market analysis
While Monday broke above the 3 week trading range, yesterday had a bear body on the daily chart. In addition, it reversed yesterday’s bull breakout. I said yesterday morning that a bear bar was likely because most trading range breakouts fail. Furthermore, a bull breakout in an overbought trend was likely to have bad follow-through buying on the next day.
The weekly chart is extremely overbought. Consequently, the odds are that it will begin to reverse down below its moving average within the next few weeks. Is this the start of the reversal down? It is too early to tell. Yet, the context is good for the bears.
Sell signal on daily chart
Yesterday created a 2 bar reversal on the daily chart. It is therefore a sell signal bar on the daily chart. If today trades below yesterday’s low or gaps below, it will trigger the sell signal. A gap down would create a 2 day island top, which is slightly more bearish if the bears can keep the gap open for a few days.
It is important to remember that most tops fail. Even though the daily chart has a decent sell setup, it has had many others since the November low. It does not matter that the weekly chart is overbought and there will be a selloff soon. Betting that any one reversal will be the start of the selloff is a low probability bet. Until there is a strong reversal down, the odds still are that every top will be followed by at least one more new high.
Overnight Emini Globex trading
The Emini is down 1 point in the Globex market. Since yesterday was a bear channel, it was a bull flag. In addition, it was an endless pullback from Monday’s gap up and rally. Therefore, the odds favor a break above the bear channel today. Furthermore, channels usually evolve into trading ranges. Hence, the bulls will probably test yesterday’s lower highs today and create a 2 day trading range.
While the pullback is still above the June 16 rally low and is therefore a bull flag, yesterday’s selloff was in a tight bear channel. Therefore the 1st reversal up will probably lead to a test of yesterday’s low. The bulls will probably need at least a small double bottom on the 60 minute chart before rallying to test Monday’s all-time high. Consequently, the odds favor a couple sideways days.
Yesterday’s setups
Here are several reasonable stop entry setups from yesterday.
EURUSD Forex market trading strategies
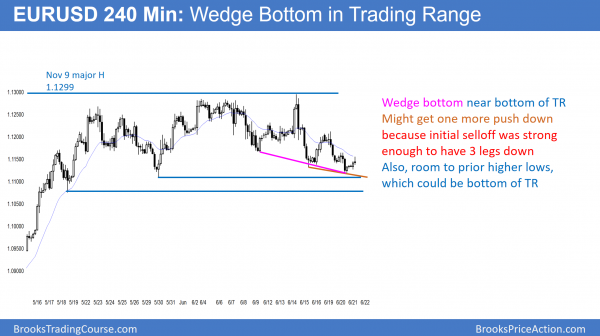
After last week’s strong selloff from a wedge top on the 240 minute EURUSD Forex chart, the market is now forming a wedge bottom. While there is already a wedge, the selloff is strong enough to make one more push down likely. Furthermore, there is room to the prior lows, which are magnets for a potential trading range bottom.
The EURUSD Forex market has been in a trading range for 5 weeks. It turned down from just 4 pips below the November 9 major lower high. Yet, the selloff so far has not been strong. In addition, the May rally was very strong. The odds therefore favor a break above the November 9 high. Yet, The pullback might 1st break below the 5 week range and fall for a measured move down to test the top of the 5 month range that ended in April.
The 240 minute chart has a wedge bottom after last week’s wedge top. However, there is room to the prior higher lows. In addition, they are logical levels for the bottom of the 5 week range. Furthermore, last week’s selloff was very strong. Therefore the odds favor 3 pushes down. Hence, the EURUSD will probably fall another 50 pips before forming a bottom to the 5 week range. Hence, day traders will continue to scalp.
Bottom of trading range
The location is good for the bulls because the EURUSD is testing the bottom of a 5 week trading range in a bull trend on the daily chart. Yet, there is no convincing bottom yet. Therefore, the odds favor traders selling the overnight rally, looking for one more push down below yesterday’s low within the next couple of days.
The bears want a strong break below the 5 week range. While they might break below the range, the odds are that the bear breakout will reverse up.
The bulls already see a wedge bottom on the 240 minute chart. They need a strong rally to convince traders that the 6 day selloff has ended and that they are now ready to test the November 9 high again.
Overnight EURUSD Forex trading
The bears have been losing momentum over the past 5 days as the selloff approaches the May 30 major higher low. Furthermore, the EURUSD 5 minute chart has been in a 20 pip range for the past 4 hours. Traders will continue to scalp until there is a strong reversal up or a strong break below the 1.1100 bottom of the 5 week range.
Summary of today’s S&P Emini futures price action and what to expect tomorrow
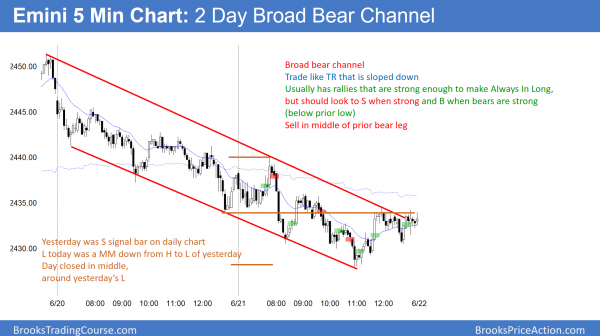
The 2 day broad bear channel continued today. The odds favor a bull breakout and transition into a 3 day trading range tomorrow.
Yesterday was a sell signal bar on the daily chart. Today was the entry bar. Since it closed reasonably far above the low and around yesterday’s low, it was a weak entry bar. It is a High 1 buy signal bar for tomorrow. Since it is the 2nd consecutive bear bar, it is a weak buy setup. When there are weak buy and sell setups, the odds favor sideways on the daily chart for another day or two.
However, the 5 minute chart had a 2 day broad bear channel. The odds are that tomorrow will break above the bear channel and form a major trend reversal. This will probably lead to a trading range, where the top of the range is around one of the lower highs in the 2 day bear channel.
See the weekly update for a discussion of the price action on the weekly candlestick chart and for what to expect going into next week.
Traders can see the end of the day bar-by-bar price action report by signing up for free at BrooksPriceAction.com. I talk about the detailed S&P Emini futures price action real-time throughout the day in the BrooksPriceAction.com trading room. We offer a 2 day free trial.
When I mention time, it is USA Pacific Standard Time (the Emini day session opens at 6:30 am PST, and closes at 1:15 pm PST). You can read background information on the intraday market reports on the Intraday Market Update page.


Hi Al, Question for you, I know “ii” is a breakout mode pattern. What is the other one ? “oio” ? I have tried to find anything I could about both of these in the books….but have not found yet. Any chance you could maybe give a few examples ? or at least direct me to where I can find some info on them. ii is straightforward enough….but the other one…”oio” if that is it …..I would like to add this to my “tool bag”. As usual….thank you so much for all you have done for us !! Steve,
The info is easy to find.
Video 8C covers those patterns.
If you have Al’s books, I would suggest using the Index in the books to find the location where it’s covered.
Thank you Alan ! Appreciate it